Model: GW - Billing Activity Operations
The GW - Billing Activity Operations model provides a detailed view of billing activity operations at the grain of the individual activity. Analysts can use the model to visualize billing operations and give supervisors visibility into their staff workloads.
Benefits of billing activity operations reporting
Billing activity operations reporting helps supervisors and managers monitor workloads across their billing staff, including activity queues, assignment statuses, escalation indicators, and completion rates. They can identify processing bottlenecks, overdue activities, balance workloads across representatives and teams, and ensure billing tasks are completed within their target time frames.
- Notification activities alert users that a significant event in a delinquency process has occurred.
- Approval activities require user approval before a delinquency process takes significant action.
Source tables
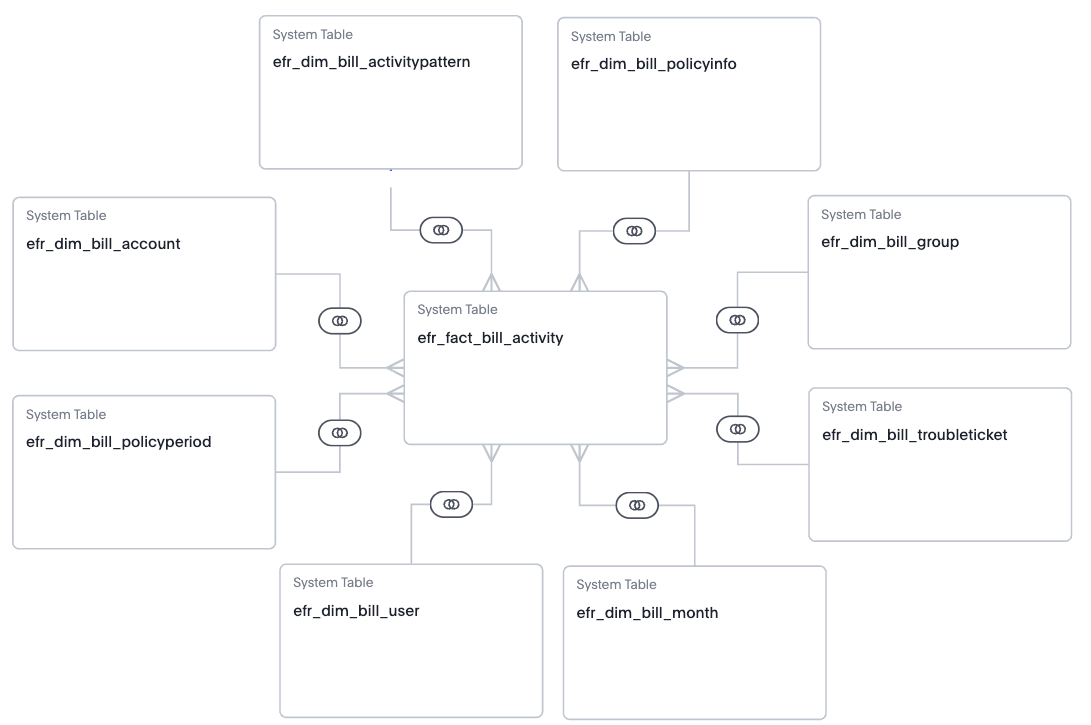
The GW - Billing Activity Operations model is built from a fact table and multiple dimension tables, as shown in the diagram.
efr_fact_bill_activity
efr_dim_bill_activitypatternefr_dim_bill_troubleticketefr_dim_bill_policyperiodefr_dim_bill_policyinfoefr_dim_bill_accountefr_dim_bill_userefr_dim_bill_groupefr_dim_bill_month
From each table, Guidewire selected specific columns to include in the model. They’re typical columns used in reporting and analysis. For details about each column in the model, see the Data dictionaries for Explore models.
Granular activity details
Each record in the model represents an individual billing activity. Each activity has attributes such as creation and assignment dates, target deadlines, priority levels, approval outcomes, triggering event, and trouble ticket details.
Activity performance and completion measures
The model includes measures of billing activity processing and completion efficiency. They help supervisors and analysts track throughput, identify trends in same-day completion, and monitor the average time required to close activities. For example:
- Completed Activity Count
- Completion %
- Same-Day Completed Activity Count
- Same-Day Completion %
- High Priority Completed Activity Count
- High Priority Same-Day Completed Activity Count
- High Priority Same-Day Completion %
- Avg Days to Close
- No Target Date Activity Count
Status, assignment, and escalation measures
The model includes columns that track the current state of activities, their assignment to users or teams, and whether they are overdue or escalated. Monitoring these metrics helps identify bottlenecks, workload distribution, and urgent issues requiring attention. For example:
- Assigned Activity Count
- Unassigned Activity Count
- Overdue Activity Count
- Overdue %
- Escalated Activity Count
- Escalation %
Priority and mandatory indicators
The model includes indicators that highlight high priority or mandatory activities, supporting risk management and compliance. They also help focus attention on urgent or required tasks. For example:
- Is High Priority
- High Priority Same Day Flag
- Mandatory Flag
- Mandatory Activity Count