Model: GW - Billing Commissions - Calendar Year
The GW - Billing Commissions - Calendar Year model includes monthly snapshots of commissions payable to producers, at the grain of the policy. The snapshots are aggregates of transaction amounts from the producer context. Analysts can use the model to visualize reserved, earned, and paid out commission amounts. They can analyze amounts by producer name, producer code, product, and other attributes.
Source tables
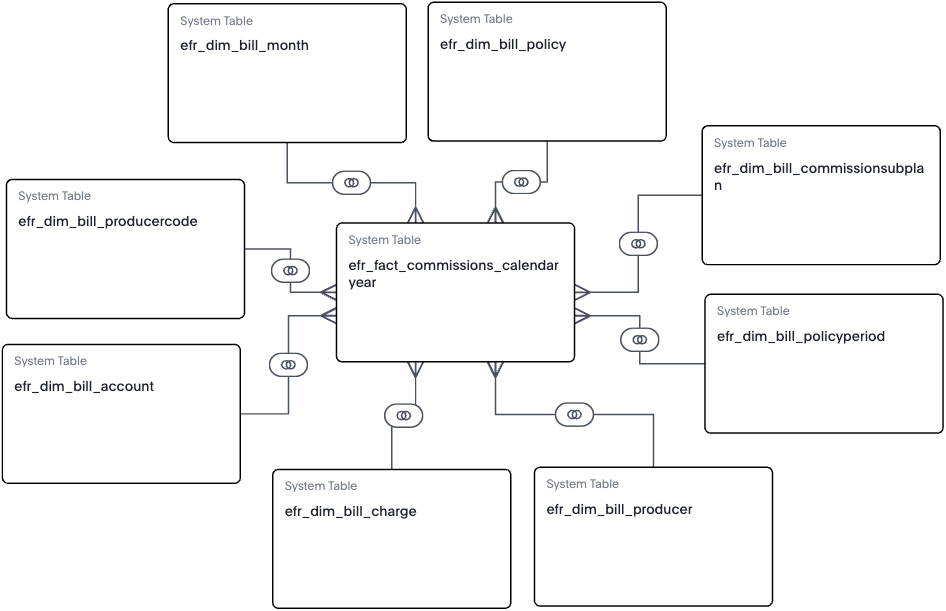
The GW - Billing Commissions - Calendar Year model is built from a fact table and multiple dimension tables, as shown in the diagram.
efr_fact_commissions_calendaryear
efr_dim_bill_commissionsubplanefr_dim_bill_producercodeefr_dim_bill_policyperiodefr_dim_bill_monthefr_dim_bill_accountefr_dim_bill_policyefr_dim_bill_chargeefr_dim_bill_producer
From each table, Guidewire selected specific columns to include in the model. They’re typical columns used in reporting and analysis. For details about each column in the model, see the Data dictionaries for Explore models.
Producer-level MTD, QTD, and YTD aggregates
The model includes Month-to-date (MTD), Quarter-to-date (QTD) and Year-to-date (YTD) aggregates for amounts related to each producer. For example, commissions, reserves, payment, expenses, and write-offs. These columns make it easier to create reports for those time periods.
Commission and reserve aggregate formulas
The model includes formulas that aggregate the producer-level data. These monthly totals help you understand the state of all commissions paid, earned, due, and reserved for the accounting period.