Navigating Explore
Explore organizes its features into the Insights, Data, and Admin workspaces. Access to each workspace depends on user role, with the Insights workspace available to all users for viewing and creating visualizations.
Navigation overview
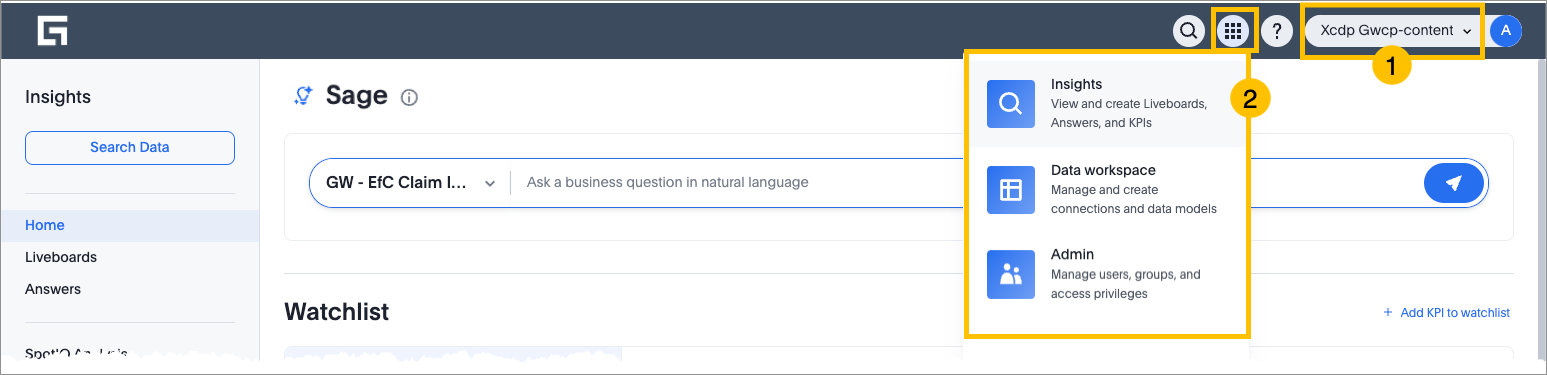
- 1. Project selector
- For users with multiple projects, select your project from the drop-down list. The liveboards, visualizations, KPIs, and data sources are updated based on the selected project.
- 2. Insights workspace
- Where you do most tasks in Explore, such as viewing and creating visualizations. Every Explore user can access this workspace.
- 3. Data workspace
- Where you manage data sources. For example, creating models, editing connections, and creating custom calendars. You can only access this workspace if you have a role that gives you access to a data management feature.
- 4. Admin workspace
- Where you administer the Explore app. For example, managing groups. You can only access admin settings if you have a role that gives you access to an admin feature.
- 5. Documentation
- Quick links to Explore documentation and release notes.
Insights workspace
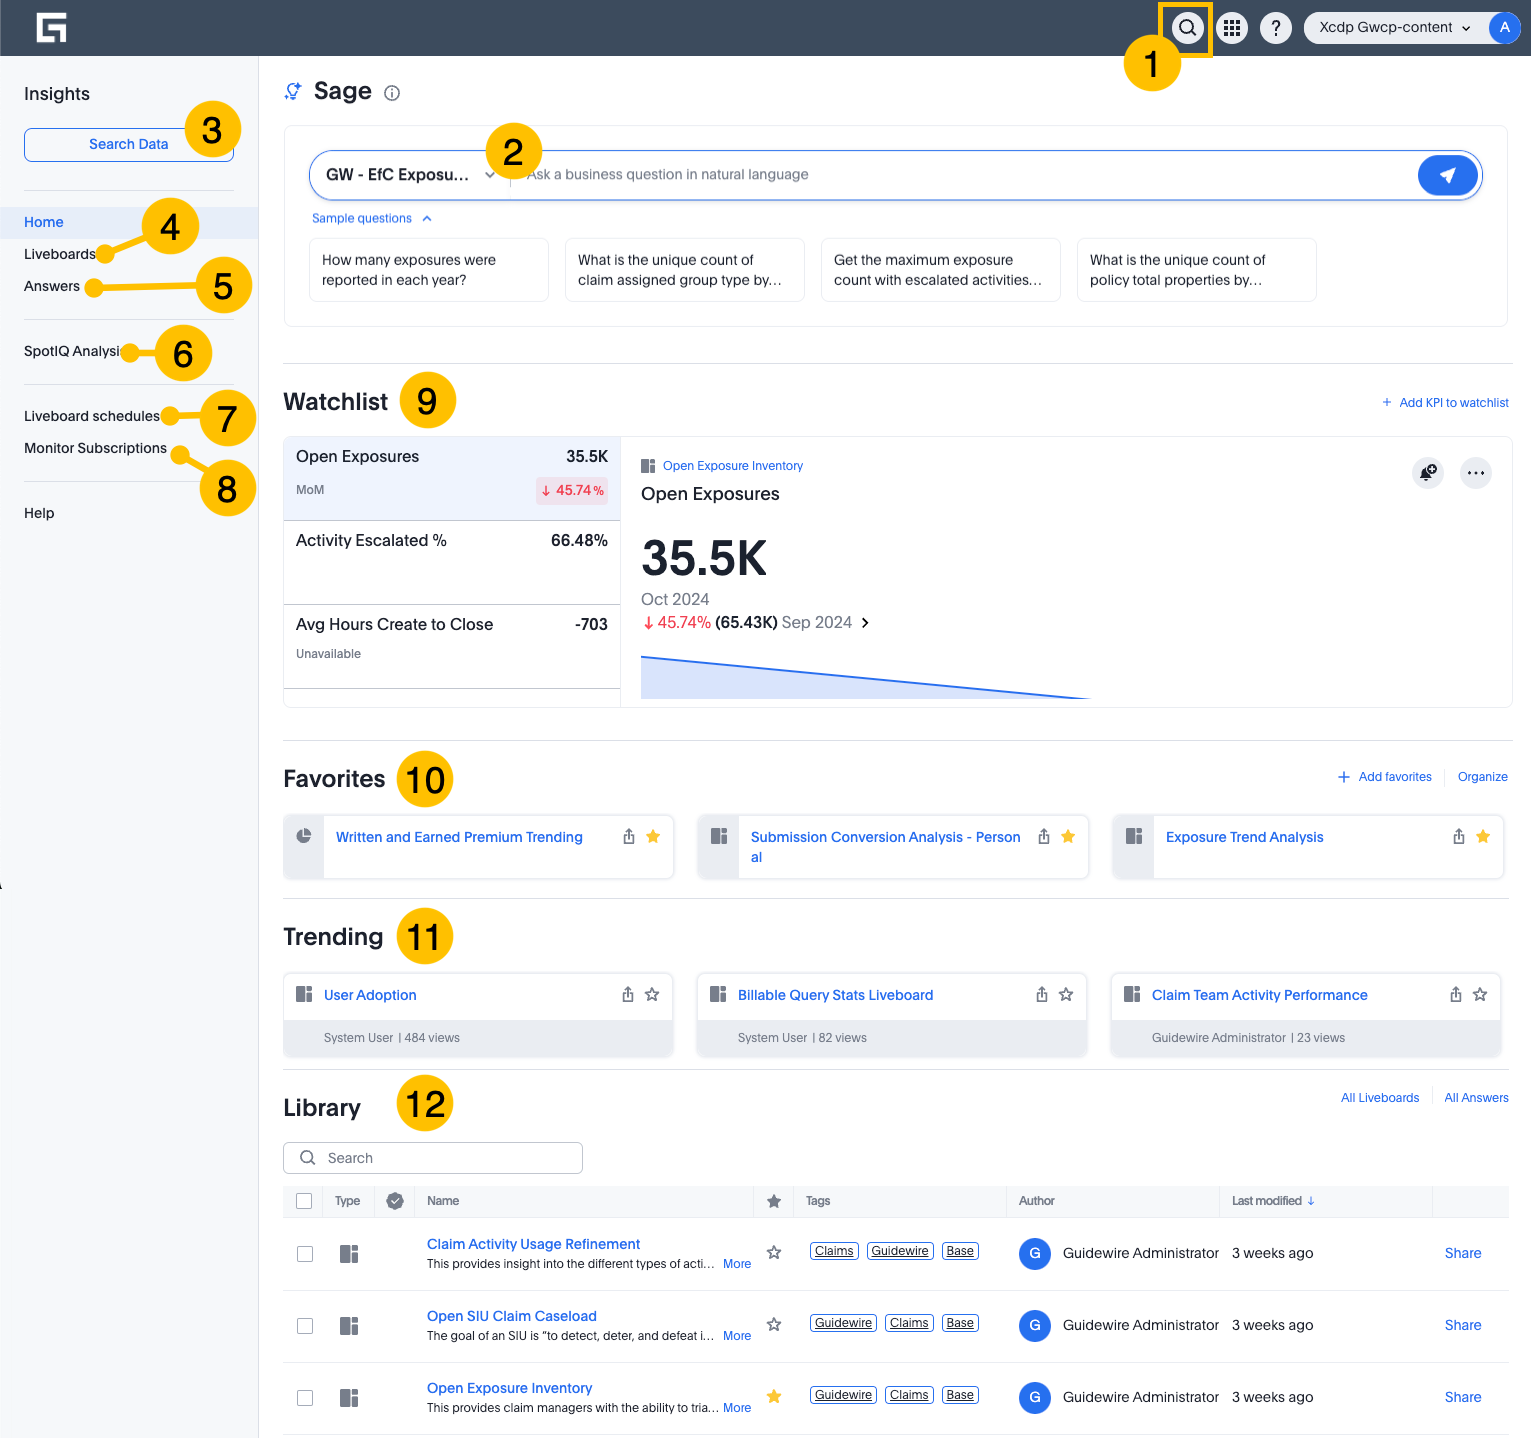
The Insights workspace includes:
- 1. Search answers and liveboards
- Ask any business question to search through existing liveboards and answers for data and visualizations matching your interests.
- 2. Search data
- Query your data to create visualizations, then save them as answers or pin them to liveboards. You can use a combination of data sources, data formulas, filters and assisted search suggestions.
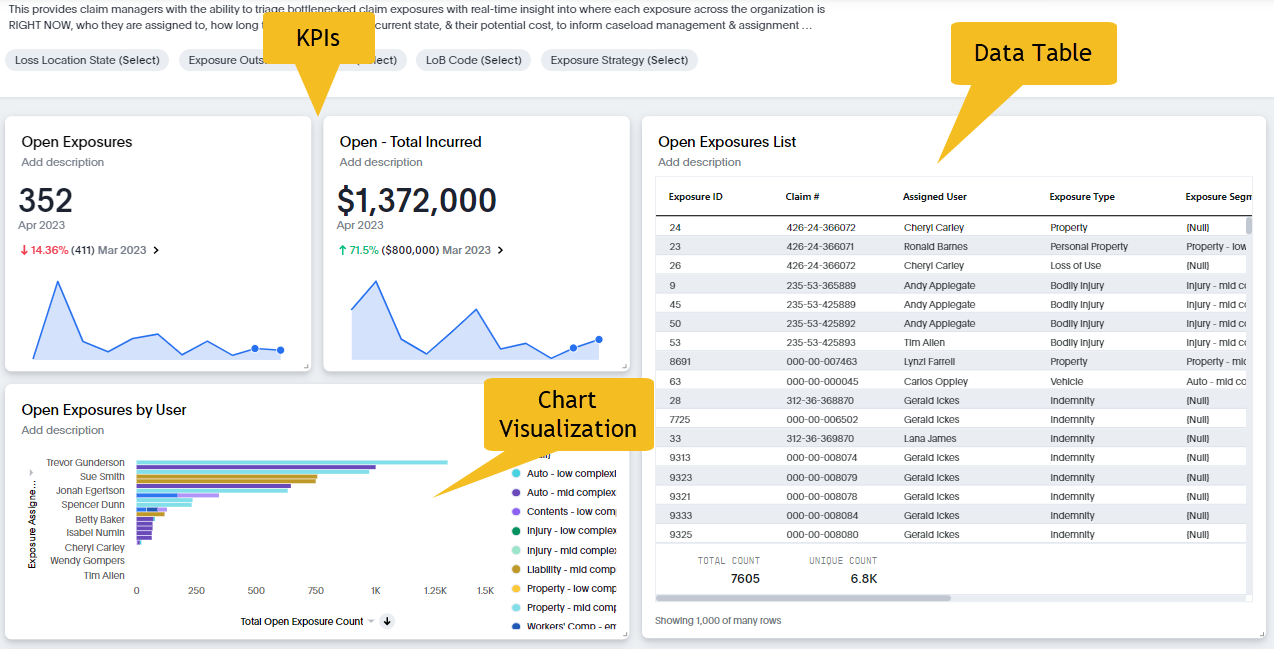
- 3. Liveboards
- A liveboard is an interactive near-real time collection of related visualization,
KPIs, and data tables. For example, Open Exposure Inventory includes metrics for
open exposures by users, open exposures by coverage, open exposures by state, and
total amount incurred from open exposures (see example figure below).
- 4. Answers
- An answer is a saved search result. You create an answer when you query your data
and save the result in the form of a table or chart/visualization:
Open Exposure Count Exposure Create Time monthly last 12 monthsThe search result returns the following visualization from the Exposure Inventory data source: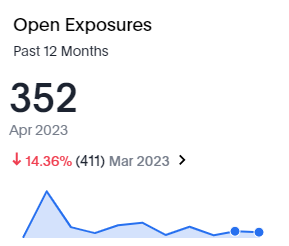
- 5. Collections
- Collections are containers that logically group Explore objects. Organize Explore tables, models, answers, and liveboards into collections so that you can find them more easily and curate sharing and collaboration.
- 6. Create liveboards and answers
- A quick way to create a new liveboard or start searching your data to create a new answer.
- 7. Liveboard schedules
- If you're subscribed to a liveboard schedule, the liveboard is sent to you on regular schedule, such as weekly at 9 a.m.
- 8. Monitor subscriptions
- Monitor is a feature that allows you to schedule alerts (email notifications) for changes in KPIs.
- 9. SpotIQ analysis
- SpotIQ is an automated assistant that aids in discovering valuable insights within your data. These insights include trends, correlations, explanations for increases, explanations for decreases, and outliers.
- 10. Favorites
- Select the star next to any liveboard or answer to add it to your favorites list on the home page and left navigation panel. You can reorder your favorites in the left navigation panel by clicking and dragging.
- 11. KPI metrics watchlist
- Add KPIs to track live metrics from your data and receive Monitor alerts about changes.
- 12. Library
- Filter, favorite, and share answers and liveboard from your home page.
- 13. Trending
- View and engage with popular liveboard and answers generated by your peers.
Customize the Insights homepage
You can customize the order of elements on the Insights home screen, or remove them. Scroll to the bottom of the page and select Customize homepage.