Analyze changes in an answer
Contextual change analysis reveals what changed and why between two data points. Examine insights by attribute to understand the contributing factors.
Before you begin
- Area
- Line
- Column
- Bar
- Line-column
- Donut
- KPI charts with sparklines
About this task
Procedure
-
To save the change analysis of a single attribute, select
More
 , then either Pin to a liveboard, Make
a copy, or Download.
, then either Pin to a liveboard, Make
a copy, or Download.
Example
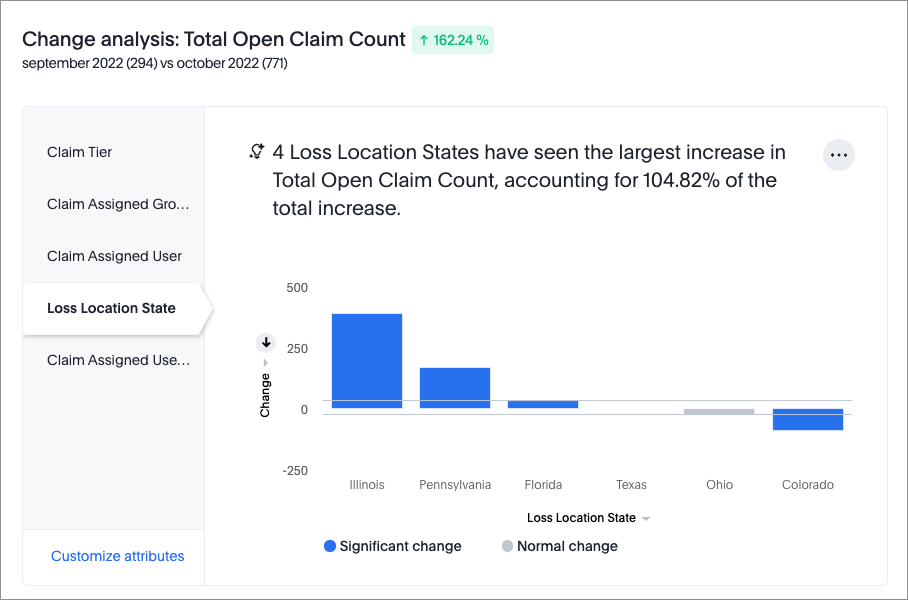
The following change analysis is for an answer that counts the total number of open claims.
The Loss Location State attribute has statistically significant outlier values, which are shown in a chart. A summary explains that those values account for a significant percentage of the increase in number of claims.
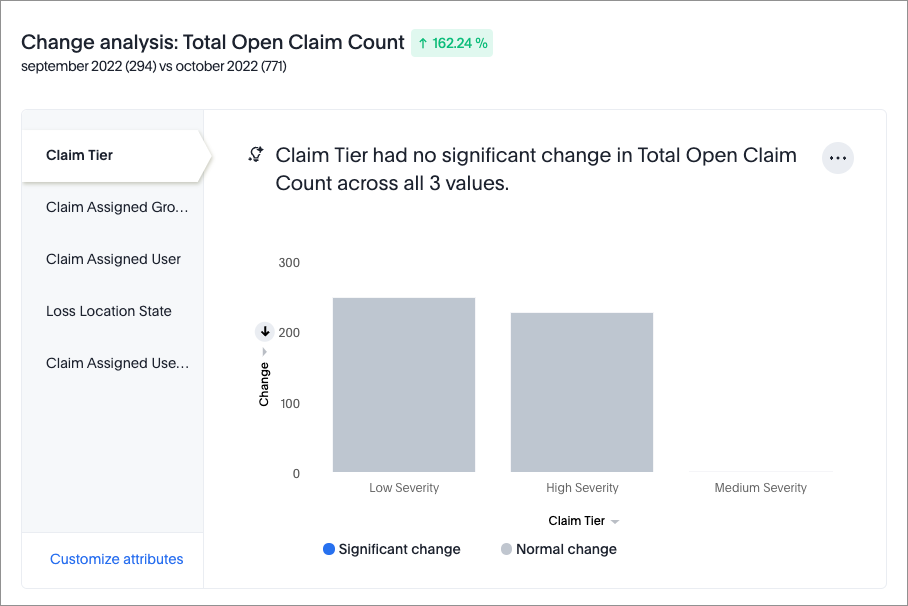
Another attribute, Claim Tier, doesn't have statistically significant outlier values. A summary explains that the attribute doesn't significantly contribute to the change in number of claims.
Note: Sometimes attribute values contribute to more than 100% of
the total change. This means that some attributes contribute to a positive trend
while others contribute to a negative trend.