Search data to create answers
Manually query your data in Explore by selecting Search data
in the Insights ![]() workspace. Explore helps with search suggestions and automatically
creates the type of chart of table that makes the most sense for the data. This query editor
also opens when you edit an existing
answer.
workspace. Explore helps with search suggestions and automatically
creates the type of chart of table that makes the most sense for the data. This query editor
also opens when you edit an existing
answer.
Types of data sources
- Models turn data from the database into a business-friendly resource that everyone can use. They are the most powerful and commonly used data sources for searching. A model is a collection of related tables, table joins, source connections, and column filtering optimized for searching. Models are similar to the standard concept of a data source view.
- Tables are the raw data sources from Data Studio. Tables include the unfiltered column names and data types for each table item.
- Base
- Claims
- Guidewire
- Loss Financials (LFITD)
- Underwriting
- EFRPolicy
- EFRClaims
For more about specific sources, see Solution content in Explore and Data dictionaries for Explore models.
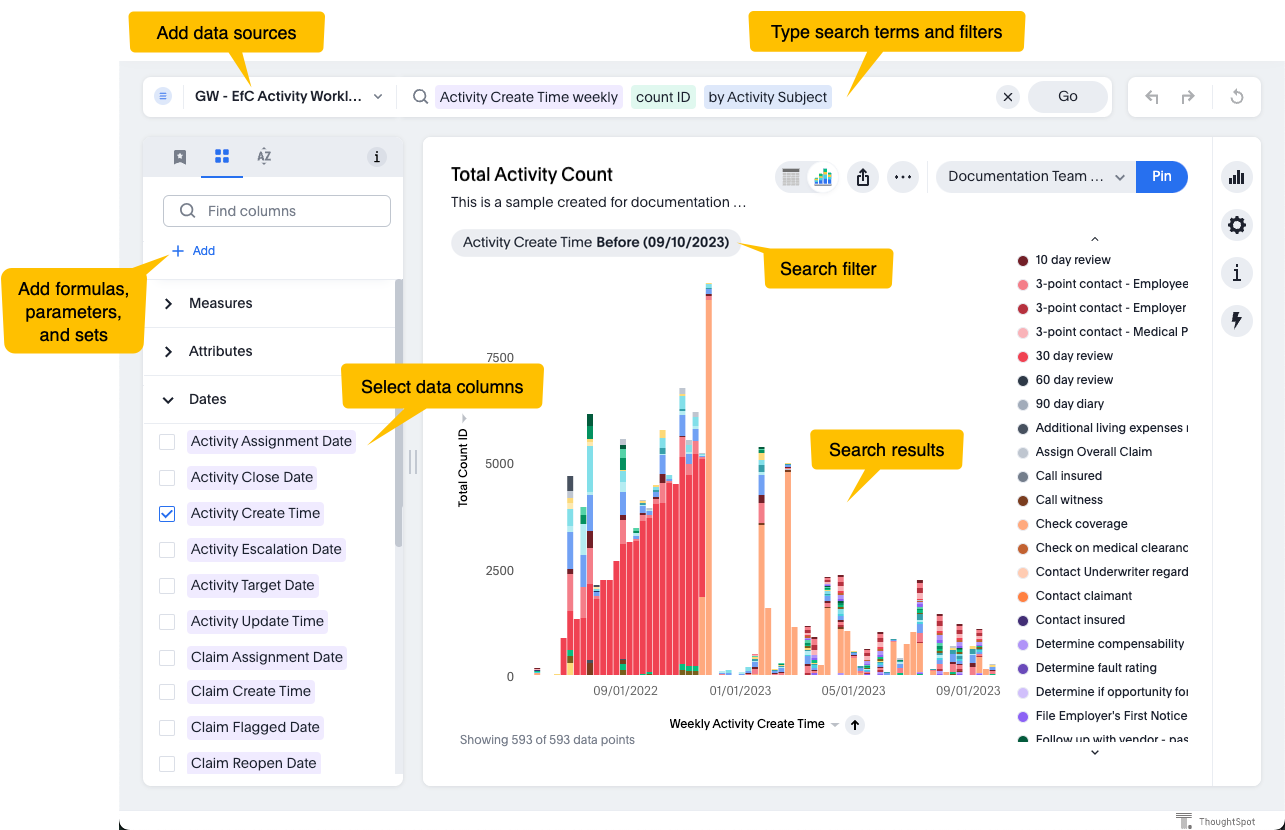
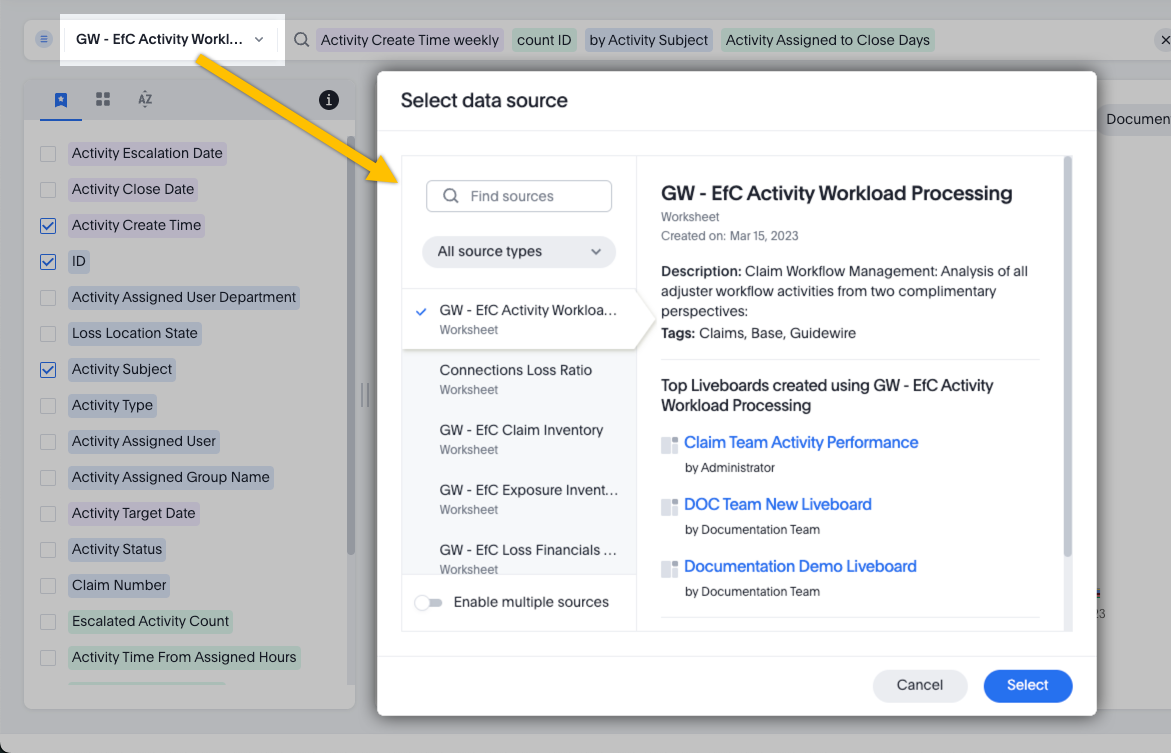
Step 1: Choose data sources
On the Search Data page, you must select one or more data sources before using them in your search query. Next to the search bar, you can select models and tables that you have access to.
The columns from your chosen data sources are listed in the panel on the left side of the screen. To learn more about a specific column, select it to open the Column information panel. Information is provided if it's available, such as the data type, description, and sample values.
Step 2: Create a search
Use the search bar to query your data sources. Instead of typing in complete sentences or SQL, use keywords. For example, "sum Open Activity Count Activity Assigned User sort by Open Activity Count descending" creates a chart listing the number of open activities for each user, in descending order.

- Type column names or values from columns.
- Add columns from the panel on the left side of the screen. To filter values,
select Add as filter
 next to the column.
 - Type special keywords such as begins with, next month, sort by, <=, and many more. See Keyword reference in the ThoughtSpot documentation.
To see the SQL that Explore is using for the search, select
Query
![]() on the right side of the screen.
on the right side of the screen.
Step 3: (Optional) Add formulas, parameters, and sets
You can add formulas, parameters, and sets in addition to your search keywords. On the left side of the screen, select the Category or A to Z view, then select + Add.
- Formulas
- Formulas are useful for mathematical functions, replacing null values, and using conditional logic. See Formulas in the ThoughtSpot documentation. You can also mask data mask data to hide the value of a column from certain groups.
- Parameters
- Parameters help you quickly run different search scenarios. A parameter is a container for adjustable values that you can insert into a formula. Instead of using a constant value in your formula, you can use a parameter that defines a variety of allowed values. When you save your search as an answer, other people can change the parameter value to change what they see in the chart or table. See Create parameters in the ThoughtSpot documentation.
- Sets
- Sets are defined groups of values that you can reuse across many answers.
For example, you can create a set to categorize products, group a range of
numbers, or define a seasonal time period. Once you share an answer with a
set, other people can use the set in their own answers. There are two types
of sets:
- Column sets: You select a group of values from within one column.
- Query sets: You can do additional filtering and aggregation before selecting values. You define a query using multiple columns, then select values from one of the columns in the query result.
What to do next
- Edit the chart or table that Explore automatically generated.
- Save your visualization to create a standalone answer, pin it to a liveboard, or do both. To learn more, see Share answers and liveboards.
- Create and apply tags to your answer.