View SpotIQ analyses
SpotIQ uses machine-assisted analysis to automatically uncovers insights in your Explore data: Trends, forecasts, correlations, explanations of increases or decreases, and outliers.
There are two ways to discover information using SpotIQ. First, select SpotIQ
Analysis in the Insights ![]() workspace to open the list of existing SpotIQ analyses. Click
on any analysis to discover information and view insights for your selected item.
workspace to open the list of existing SpotIQ analyses. Click
on any analysis to discover information and view insights for your selected item.
Second, click the More ellipsis for any KPI, chart, or data table
and select the SpotIQ analyze option. Follow the prompts to create a SpotIQ analysis.
Review the measures and attributes suggested by SpotIQ. When your review is complete,
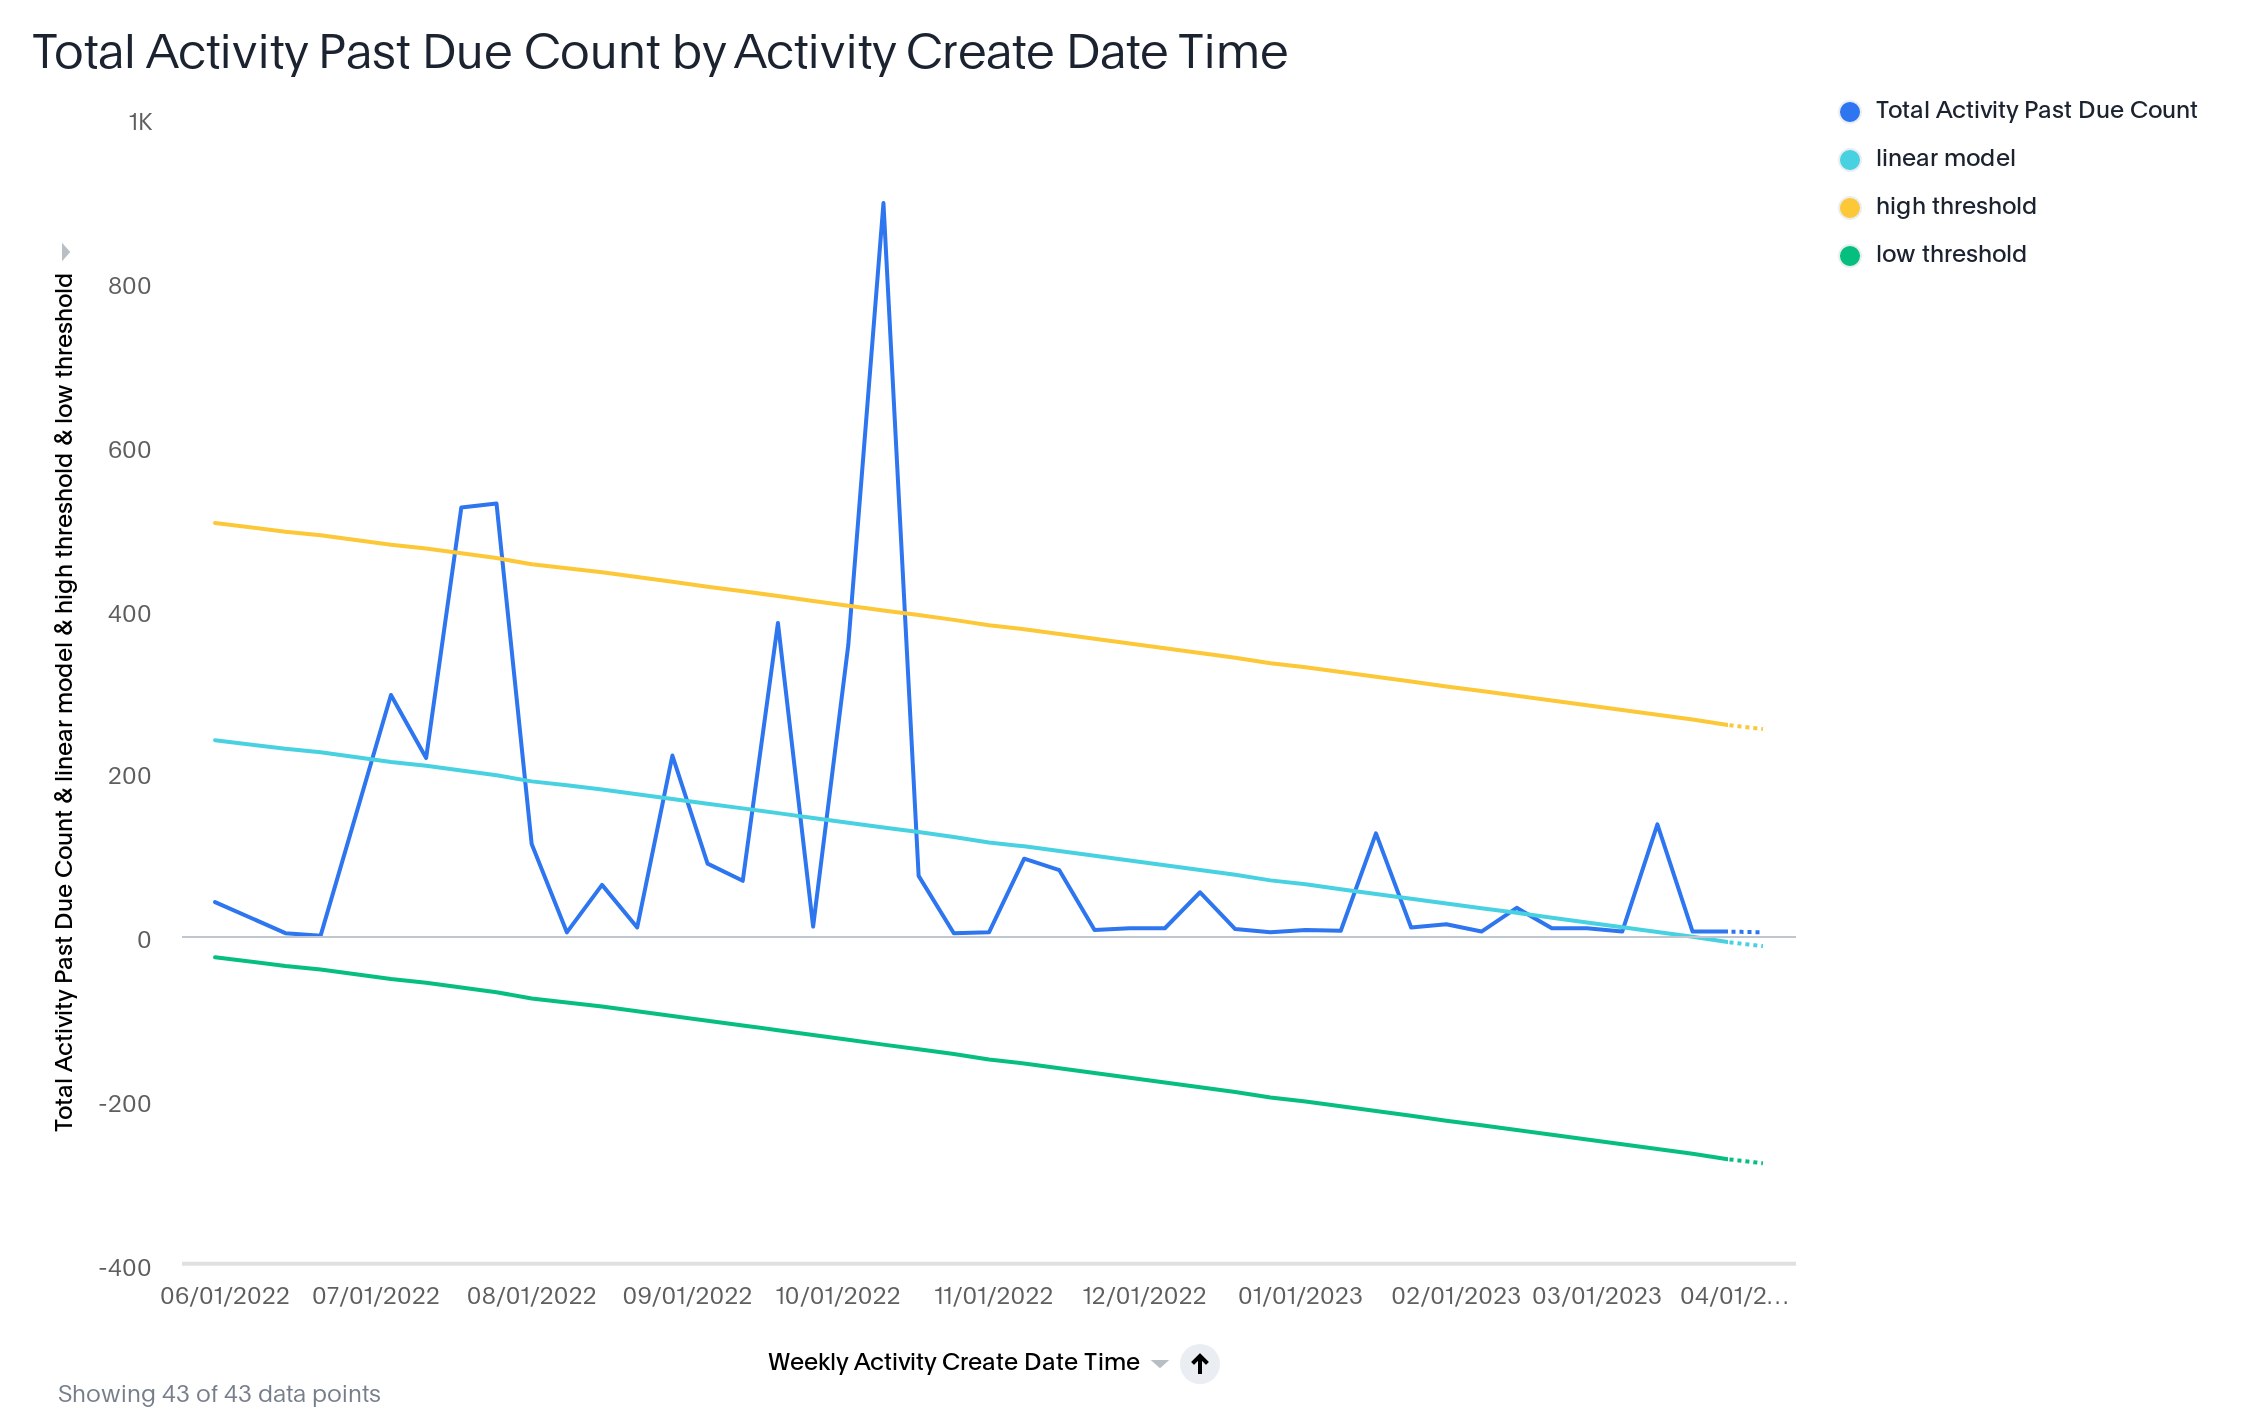
click the Analyze button to perform the analysis. Click the Take me to the Analysis
button to review the analysis results (see the SpotIQ example threshold analysis figure
below).