Model: GW - Exposure Inventory History
Exposure Inventory History offers a monthly historical analysis of exposure volumes and status changes, enabling detailed tracking and analysis of exposure trends across various business dimensions.
Source tables
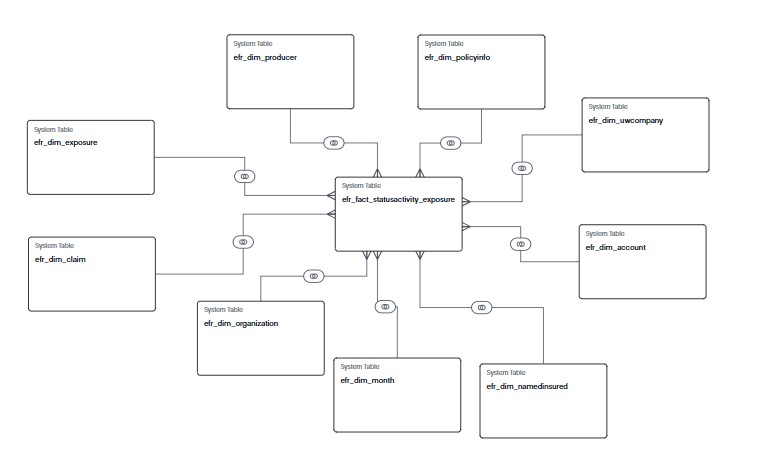
The GW - Exposure Inventory History model is built from a fact table and multiple dimension tables, as shown in the diagram.
efr_fact_statusactivity_exposure
efr_dim_uwcompanyefr_dim_exposureefr_dim_claimefr_dim_producerefr_dim_policyinfoefr_dim_organizationefr_dim_accountefr_dim_namedinsuredefr_dim_month
From each table, Guidewire selected specific columns to include in the model. They’re typical columns used in reporting and analysis. For details about each column in the model, see the Data dictionaries for Explore models
Formulas
Each row in the model represents one claim for one calendar month. The measures capture counts of new, reopened, and closed claims for that month, and these measures reconcile to the month-end pending exposure inventory.
For every month, the following identity holds:
- prior month-end pending claims exposure
- +new (this month)
- + reopened (this month)
- − closed (this month)
- = current month-end pending claims exposure inventory
A parallel exposure-level model applies the same status-activity logic at exposure grain, while also carrying the parent claim so you can drill from exposure-level patterns up to claim-level views.