Model: GW - Profitability
GW - Profitability includes month-to-date and year-to-date loss ratios and expense ratios. It combines calendar year premium and calendar year loss metrics into one model. Analysts can use the model to create visualizations that monitor profitability. They can view loss and expense ratios by state, product, producer, and other attributes.
Source tables
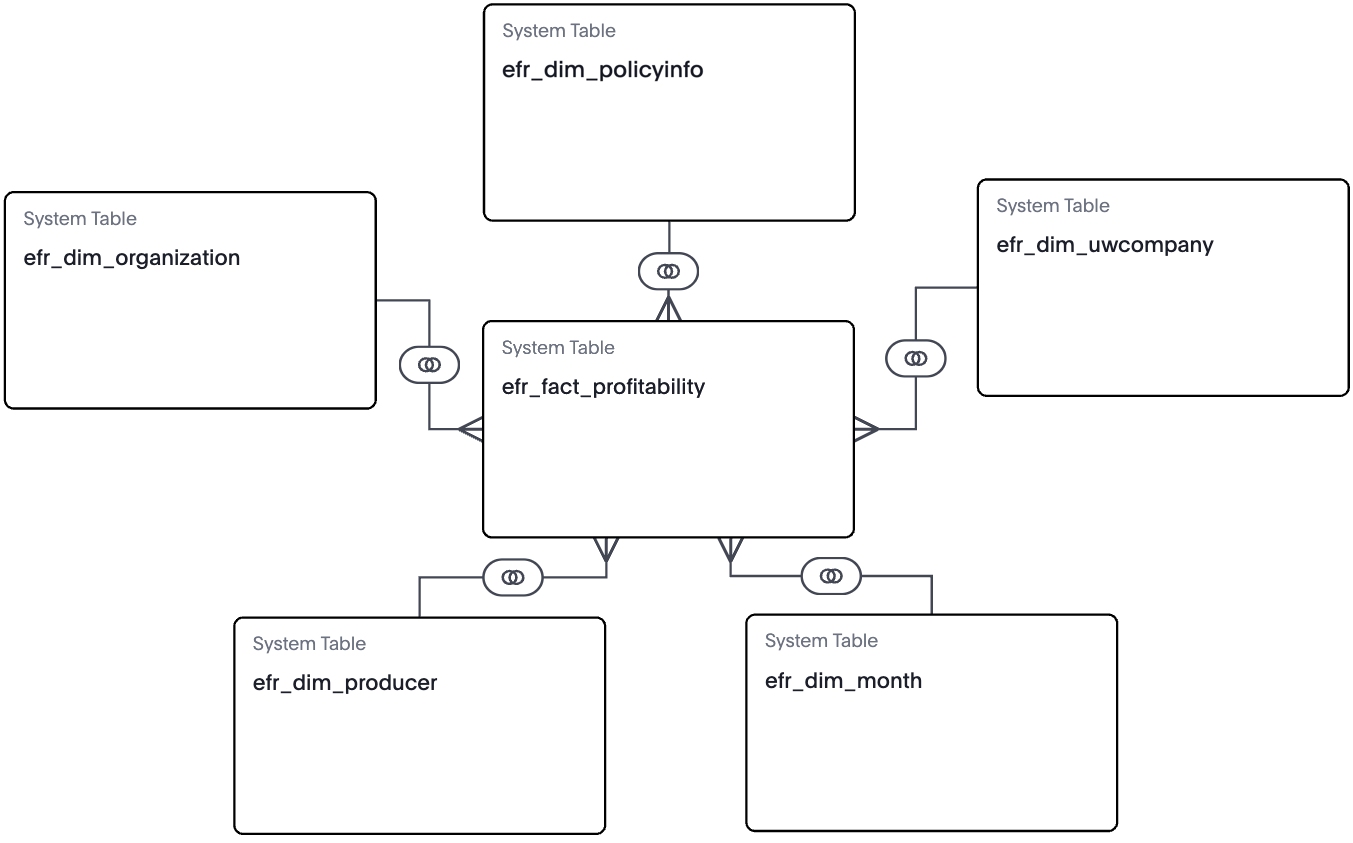
The GW - Profitability model is built from a fact table and multiple dimension tables, as shown in the diagram.
efr_fact_profitability
efr_dim_uwcompanyefr_dim_organizationefr_dim_producerefr_dim_policyinfoefr_dim_month
From each table, Guidewire selected specific columns to include in the model. They’re typical columns used in reporting and analysis. For details about each column in the model, see the Data dictionaries for Explore models.
Formulas
Many of the model’s columns are the result of formulas created on the model in Explore. The formula columns aren’t part of the source tables in Explore or Data Studio. Each formula performs a calculation or conversion, usually using source table columns, and the result is an additional column in the model.
For a list of all formula columns and their expressions, see the Data dictionaries for Explore models.
These formulas convert dates into business-friendly strings:
- Accounting Month: The first day of the accounting month
- Accounting Period: The accounting month
Other formulas calculate:
- Aggregate amounts for various indemnity, loss, and expense amounts
- Expense and loss ratios
MTD and YTD aggregates
- MTD and YTD Indemnity Incurred
- MTD and YTD Earned Premium
- MTD and YTD Expense Ratio