Filter liveboards
Filter a liveboard using answer data
About this task
Explore allows you to filter a liveboard based on column attributes for most
types of charts and data tables. For example, filter only the activity subject
Produce a claims strategy narrative using the following
procedure (see the Total Activity Count stacked bar chart for reference):
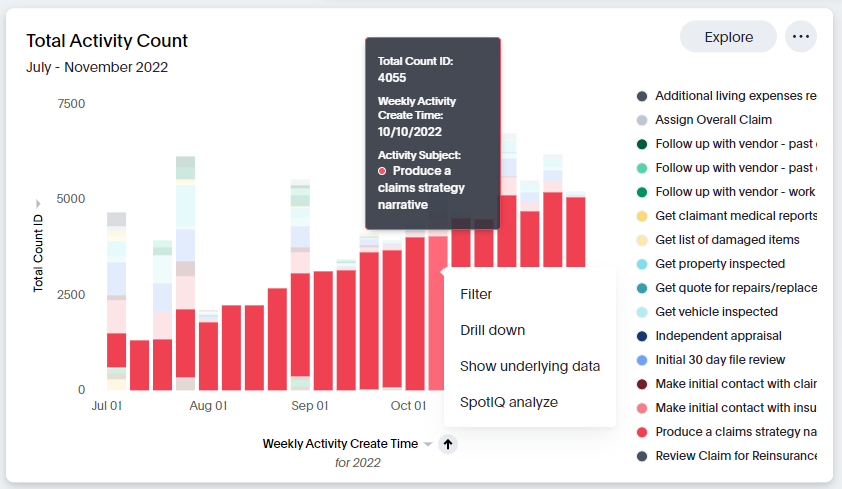
Procedure
-
Right click the activity subject bar and choose the Filter option in the
select list.
- Optional: click the More ellipsis to Make a copy of your filtered results or Pin your filtered results to a liveboard.
- Optional: click the Explore button in your visualization to edit your filtered results.
The chart now displays your filter for the Produce a claims strategy narrative activity subject (see sample figure below).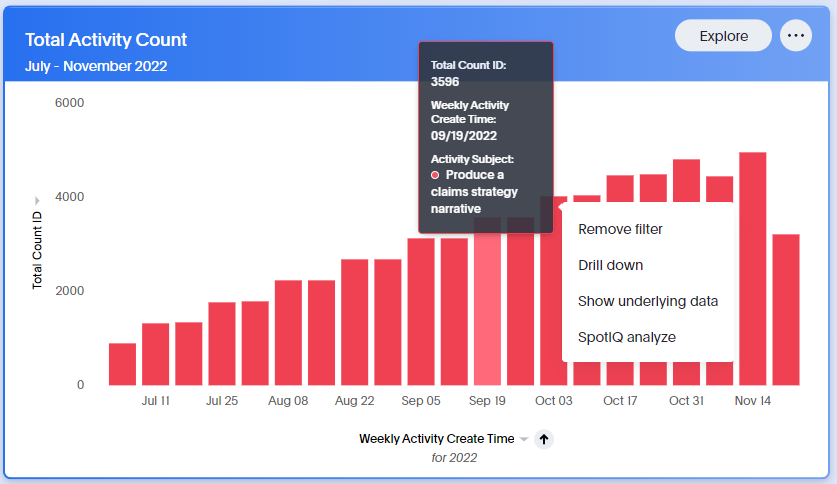
Example
This microanimation shows how to create a filter for the Produce a
claims strategy narrative activity subject using the following
steps:
- Move your cursor over the Produce a claims strategy narrative data column.
- Right click the data column and choose the Filter option from the select list.
- Interact with the new filtered visualization using the Explore button and the More ellipsis.
- To remove your filter, right click on any data column and choose the Remove filter option from the select list.
Save a personalized view of a filtered liveboard
About this task
You can apply filters to a liveboard so that it only displays information that's relevant to you, then save that filtered version as a personalized view. The personalized view is synced with the original liveboard, meaning that any changes made to the original liveboard appear in the personalized view. Other people can see your personalized view if you make it available to them.
Important: If the original liveboard is deleted,
your personalized view is deleted too. If you need to prevent that, an
alternative is to make a copy of the liveboard. Select More  > Make a copy, then add your filters. This copy is not synced with the original
liveboard, so changes made to the original won't appear on your copy.
> Make a copy, then add your filters. This copy is not synced with the original
liveboard, so changes made to the original won't appear on your copy.
Procedure
-
Filter a liveboard by either:
-
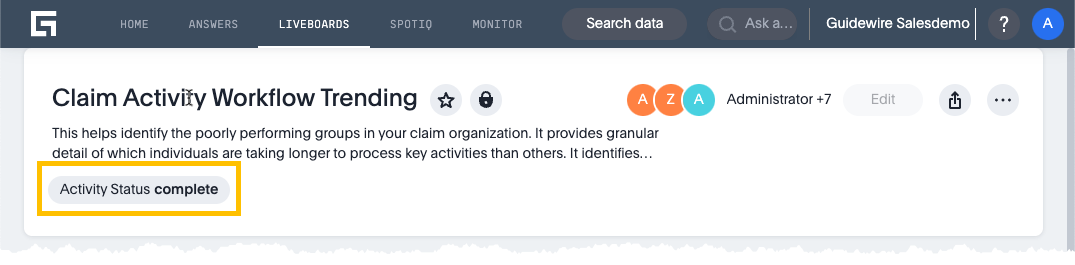
Selecting filters that are already on the liveboard. They display
below the liveboard title.
-
Selecting filters that are already on the liveboard. They display
below the liveboard title.
- Select Save view.
- To let other people to see your view, select Make view available to all users.