Model: GW - Claim Reserve Adequacy
The GW - Claim Reserve Adequacy model measures whether reserves are adequate for the actual amount incurred by developing claims so that you can set accurate reserve amounts. Analysts can use the model to create visualizations that compare the initial (day-0) reserve to the current total incurred at multiple evaluation checkpoints over time. They can analyze adequacy by line of business, state, and other attributes.
Benefits of claim reserve adequacy insights
After a new claim is reported, a reserve amount is set that anticipates what the ultimate pay out will be once the claim is closed. It is critical to set this reserve amount accurately because it drives how much risk you can take on. If reserves are too low, the company is under‑reserving and taking more risk than they think. If reserves are too high, the company is over‑reserving and is locking up capital they could use elsewhere.
Reserve adequacy reporting helps actuarial, finance, and claims leaders answer questions like:
- “Are we systematically under‑ or over‑reserving in certain lines of business or segments?”
- “How does the claim actually develop compared to the original reserve amount?”
Source tables
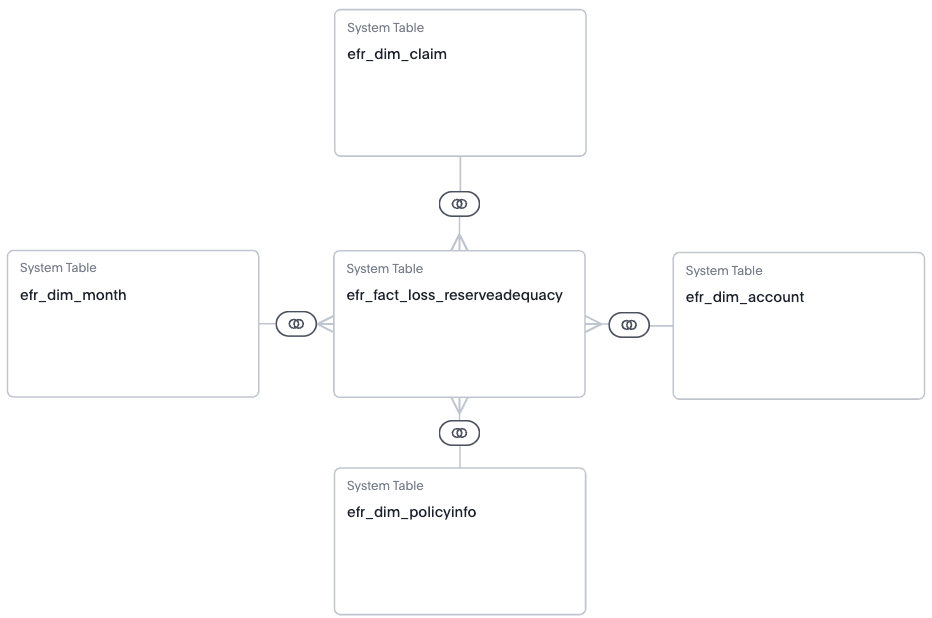
The GW - Claim Reserve Adequacy model is built from a fact table and multiple dimension tables, as shown in the diagram.
efr_fact_reserveadequacy
efr_dim_accountefr_dim_claimefr_dim_policyinfoefr_dim_month
From each table, Guidewire selected specific columns to include in the model. They’re typical columns used in reporting and analysis. For details about each column in the model, see the Data dictionaries for Explore models.
Monthly claim snapshots
Each record in the model represents a month-end snapshot of a claim, including its current incurred amount as of that month. A claim stops generating snapshots after the December of its last transaction year. Since the model captures claim data each month, you can track claim development and reserve adequacy over time using the measures described in the following sections.
Adequacy measures
- Development Variance: Shows the dollar difference between current incurred and the initial reserve. Use it to understand financial impact and prioritize large exposures.
- Reserve Development Ratio: Compares current incurred with the initial reserve as a percentage. Use it to compare adequacy across different claim sizes, products, or lines of business that may have very different dollar amounts.
- Development Classification: Groups claims into buckets: Under-reserved, adequate, over-reserved, or indeterminate. Use this column for operational workflows and segmentation. Claims leaders can filter claims and report counts without interpreting dollar amounts or ratios. The tolerance band prevents insignificant differences from being treated as meaningful.
- Under Reserved Claims: Shows the percentage of specifically under-reserved claims. Use it to monitor the breadth of claims that may need additional reserves.
Evaluation checkpoints
- 30 days and less: Early warning for short-tail claims, such as auto collision. You can quickly identify reserve issues and still have time to correct them.
- 31–60 days: Mid-term check for short- to medium-tail claims that provides a more informed adequacy view without waiting for quarterly reporting.
- 61–90 days: A common quarterly reporting checkpoint for many lines of business. It often balances timeliness with enough development to support quarterly analysis.
- 91–180 days: A maturity checkpoint for long-tail claims with additional litigation, medical costs, or other delayed development.
- 181–365 days: A long-term view for long-tail claims. Useful for annual analysis.
- More than 365 days: An even longer-term view for claims such as workers’ compensation or medical malpractice, where meaningful development may take a year or longer.
Accident and development years for runoff triangles
- Accident Development Year Number: The development year the claim is in. Use this for the column axis in the triangle.
- Accident Year: The calendar year in which the loss occurred. Use this for the row axis in the triangle.
- Accident Development Label: Label combining the accident and development years.
- Is Accident Year Eval: Flag that identifies only December month-end snapshots in the model. Use it to select the year-end diagonal for triangles.