Overview of Guidewire Compare
Guidewire Compare is an analytic tool that shows claims-related metrics from data that was pre-filtered in accordance with your specification. Specifically, the tool enables you to see operational claims metrics derived from InsuranceSuite and to compare those claims to one of the following benchmarks of relevant peers: all companies, Canadian companies, or U.S. companies.
The data in a benchmark is anonymous and aggregated, with company-specific details in the benchmark additionally hidden by the specific way that Guidewire calculates the metrics.
- Claim duration
- Subrogation
- Reserving
- Catastrophe management
- Litigation
- Indemnity payments
To improve those outcomes, you combine data analysis with knowledge of your company’s operation, a combination that can lead to targeted changes in your operation. To evaluate the effect of any such change, you review data that is specific to your company. To evaluate an earlier change, you can review metrics from an earlier period.
Compare is designed to handle a scenario, which is a construct that you use to compare pairs of claim datasets; typically one pair and potentially many. Each pair is called a comparison.

Each dataset is a collection of settings that you define inside the product. You can reuse a dataset in different scenarios, and, in the product's dataset list, you can see at a glance which scenarios include a given dataset.
All the comparisons in a single scenario apply to the same metric level, whether claims or exposures. If the metric level is claims, you can configure a dataset to explore a subset of claims; for example, by date. If the metric level is exposures, you can configure a dataset to explore a subset as well; for example, a subset of exposure types, each representing a different kind of coverage. In any case, a dataset is a filtered collection of data, whether data from your own company or from a benchmark.
To keep users from identifying which companies contributed to a benchmark, each of three or more companies must contribute a minimum amount of data, as measured after the filter is applied. The minimum data per company is what is sourced from twenty claims or exposures, depending on the metric level. One of the organizations can be your own, but three other organizations are required if the number of claims or exposures from your own company's data is insufficient.
Most Compare customers provide their data nightly. By default, the metrics retrieved from the database are current as of the date and time that your request is processed. However, you can specify a perspective date, which provides a snapshot of claims data that was current at the time. The snapshot ignores subsequent changes.
You can invoke a scenario export to receive an Excel worksheet of summary and detailed data. The summary data is present for both benchmark data and your company data, whereas the detailed data is present only for your company data. The lack of detailed data for a benchmark further protects the confidentiality of the contributing organizations.
How Guidewire Compare calculates metrics
Metrics are calculated in the context of exposures or claims. If you plan to filter by coverage, exposure-level metrics are likely more meaningful, as coverages are tracked at that level. Alternatively, if you plan to inspect data at a level higher than coverage, claim-level metrics are appropriate; for example, to review recovery transactions that are being tracked at the claim level or to measure overall cycle times.
In relation to exposures or claims, the summary metrics for a benchmark is based on an average of averages, which is a calculation that hides the data contributor.
For example, assume the following input to the benchmark calculation for indemnity.
| Company | Exposures in the Contributed Dataset | Mean Indemnity in Dollars |
|---|---|---|
| A | 1000 | 100 |
| B | 500 | 200 |
| C | 2000 | 50 |
Instead of stating the benchmark indemnity as a weighted average, Guidewire reports $117, which is the sum of the average indemnities ($100 + $200 + $50) divided by 3.
The result does not give information about the average exposure throughout the industry, but enables you to fulfill the product's main purpose: to compare your company's performance against the performance of other insurers within the definition of a particular benchmark category.
How Guidewire Compare presents metrics
Compare displays comparative metrics as well as a series of graphics that enable you to identify at a glance whether metrics in the leftmost compared dataset are better or worse than the metrics in the rightmost one.
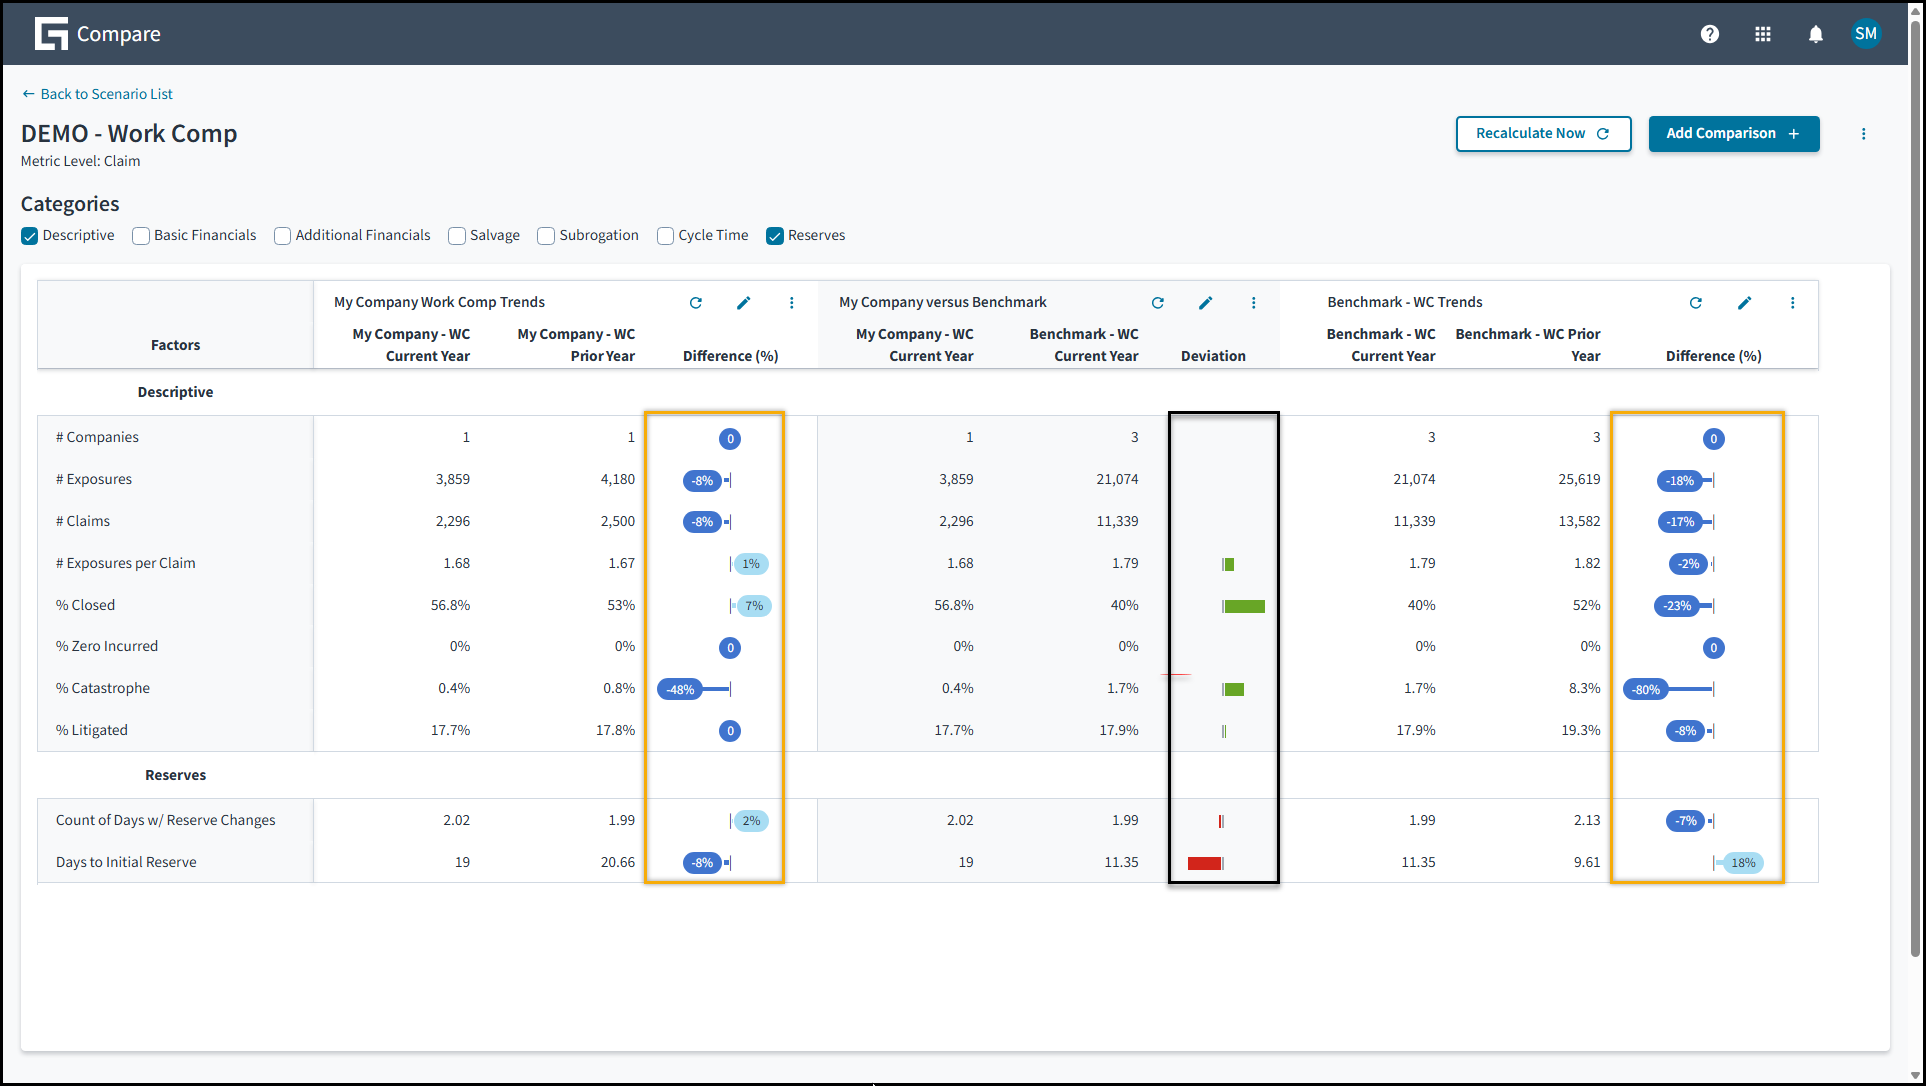
- At the left is a comparison of the organization's current data and its data from the
previous year.
If the leftmost dataset provides a smaller value by percent, a dark blue shape is displayed with a negative value; and if the leftmost dataset provides a larger value by percent, a light blue shape is displayed with a positive value.
A lack of difference is indicated by a zero in dark blue.
- In the middle is a comparison of the organization's current data and a benchmark's
current data.
When a benchmark is included, Compare displays a series of graphics in the Deviation column so that you can identify at a glance which metrics in the leftmost dataset are better or worse than the metrics in the rightmost one. If better, the graphics are green; if worse, red. In each case, the length of the bar indicates the magitude of difference.
No bars are displayed if the metrics aren't relevant to a determination of which values are better or if the values being compared are identical.
- At the right is a comparison of the benchmark's current year and the benchmark's previous year.
Jutro user-interface capabilities in Guidewire Compare
- To search for one or more entries in a list, start typing into a search bar. The search reviews content in every column in the table, including columns that you've hidden.
- To reorder entries in an onscreen table, select a table header.
- To change the appearance of the table, move to the top of
the screen, select the gear icon, and respond to a dialog that
enables you to do as follows:
- To display or hide a column, select or clear the related check box.
- To change the position of a table column, move to the right of the column name and select an up or down arrow.
Onboard Guidewire Compare
To onboard Compare, ask your organization's IT staff to access the Onboarding Process Overview.