Debugging tests
Running tests in VS Code
There are several ways to run tests in VS Code, all described in their Node.js debugging guide.
We recommend you try the following approach.
Enable auto-attach
This is a one-time action.
- In VS Code, press
Ctrl+Shift+P(Cmd+Shift+P) to open the Command Palette. - Find an option called Debug: Auto Attach and select it.
- A menu pops up. Select Smart. This will enable VS Code to automatically attach to Node.js processes launched in debug mode.
Debug a test
If this is your first time debugging in an app folder, you may see the screenshot below and not the "green arrow" to start debugging. Click Show all automatic debug configurations and select "Node.js". Then you can see the list of scripts to run from package.json.
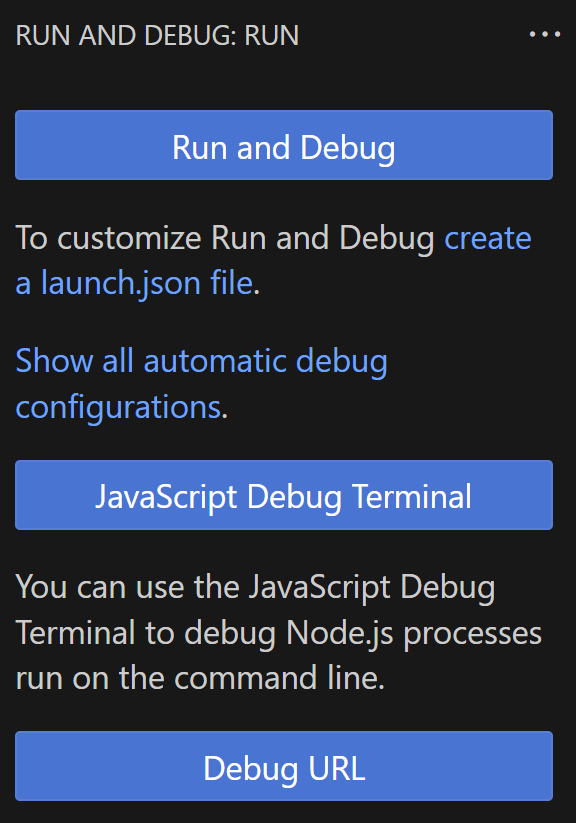
After you run once, you can find the Javascript Debug Terminal in the terminal view when creating a new terminal.
- Open a test file and set a breakpoint.
- Press
Ctrl+Shift+D(Cmd+Shift+D) to open the Debug view. - Click the down arrow next to the green play button and select Node.js. You get a list of all scripts available in your
package.jsonfile. - Select Run Script: test.
- Press the green play button.
This runs Jest in debug mode. The debugger stops at the breakpoint you added.
Run only one test file
You need to modify this configuration every time you want to run a different test file.
-
Press
Ctrl+Shift+D(Cmd+Shift+D) to open the Debug view. -
Click the down arrow next to the green play button and select Node.js. You get a list of all scripts available in your
package.jsonfile. -
Select Run Script: test. This selects the test in the Debug view.
-
Select the cog icon. This adds the test configuration to
launch.json.{
"type": "node-terminal",
"name": "Run Script: test",
"request": "launch",
"command": "npm run test",
"cwd": "${workspaceFolder}"
} -
Modify the line which says
"command": "npm run test",to say"command": "npm run test -- ${workspaceFolder}/src/pages/Welcome/__tests__/Welcome.test.js --watch",where
${workspaceFolder}/src/pages/Welcome/__tests__/Welcome.test.jsis the path to your test file.The
--watchoption enables watch mode. This means that Jest re-runs the test every time you save the file.noteIn case the
npm run testcommand doesn’t trigger the breakpoints for you, try usingjutro app:testsinstead. -
Press the green play button.
Run only one test
You need to modify this configuration every time you want to run a different test file.
To run only one test, use the -testNamePattern (or -t) option.
- Prepare a debug config as described in the previous section.
- Modify the line which says
"command": "npm run test",to say"command": "npm run test -- -t 'Welcome Page render Welcome page main image'",
In this example we are running only one test called render Welcome page main image but this test's it is within a describe directive called Welcome Page. So, our -t argument follows the pattern:
"command": "npm run test -- -t '<describeString> <itString>'",
Running tests from IntelliJ Idea
To run tests from IntelliJ Idea:
- Right-click a test file and select a run option. IntelliJ creates a build configuration.
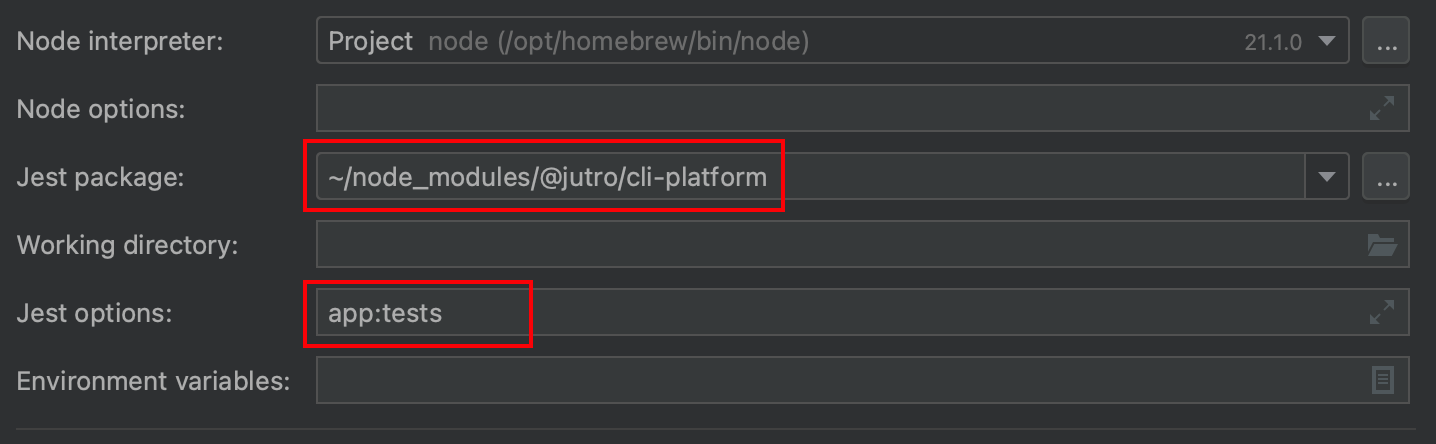
- In the build configuration options change:
- Jest package to
node_modules/@jutro/cli-platform - Jest options to
app:tests
- Jest package to
Your options should look similar to the following:
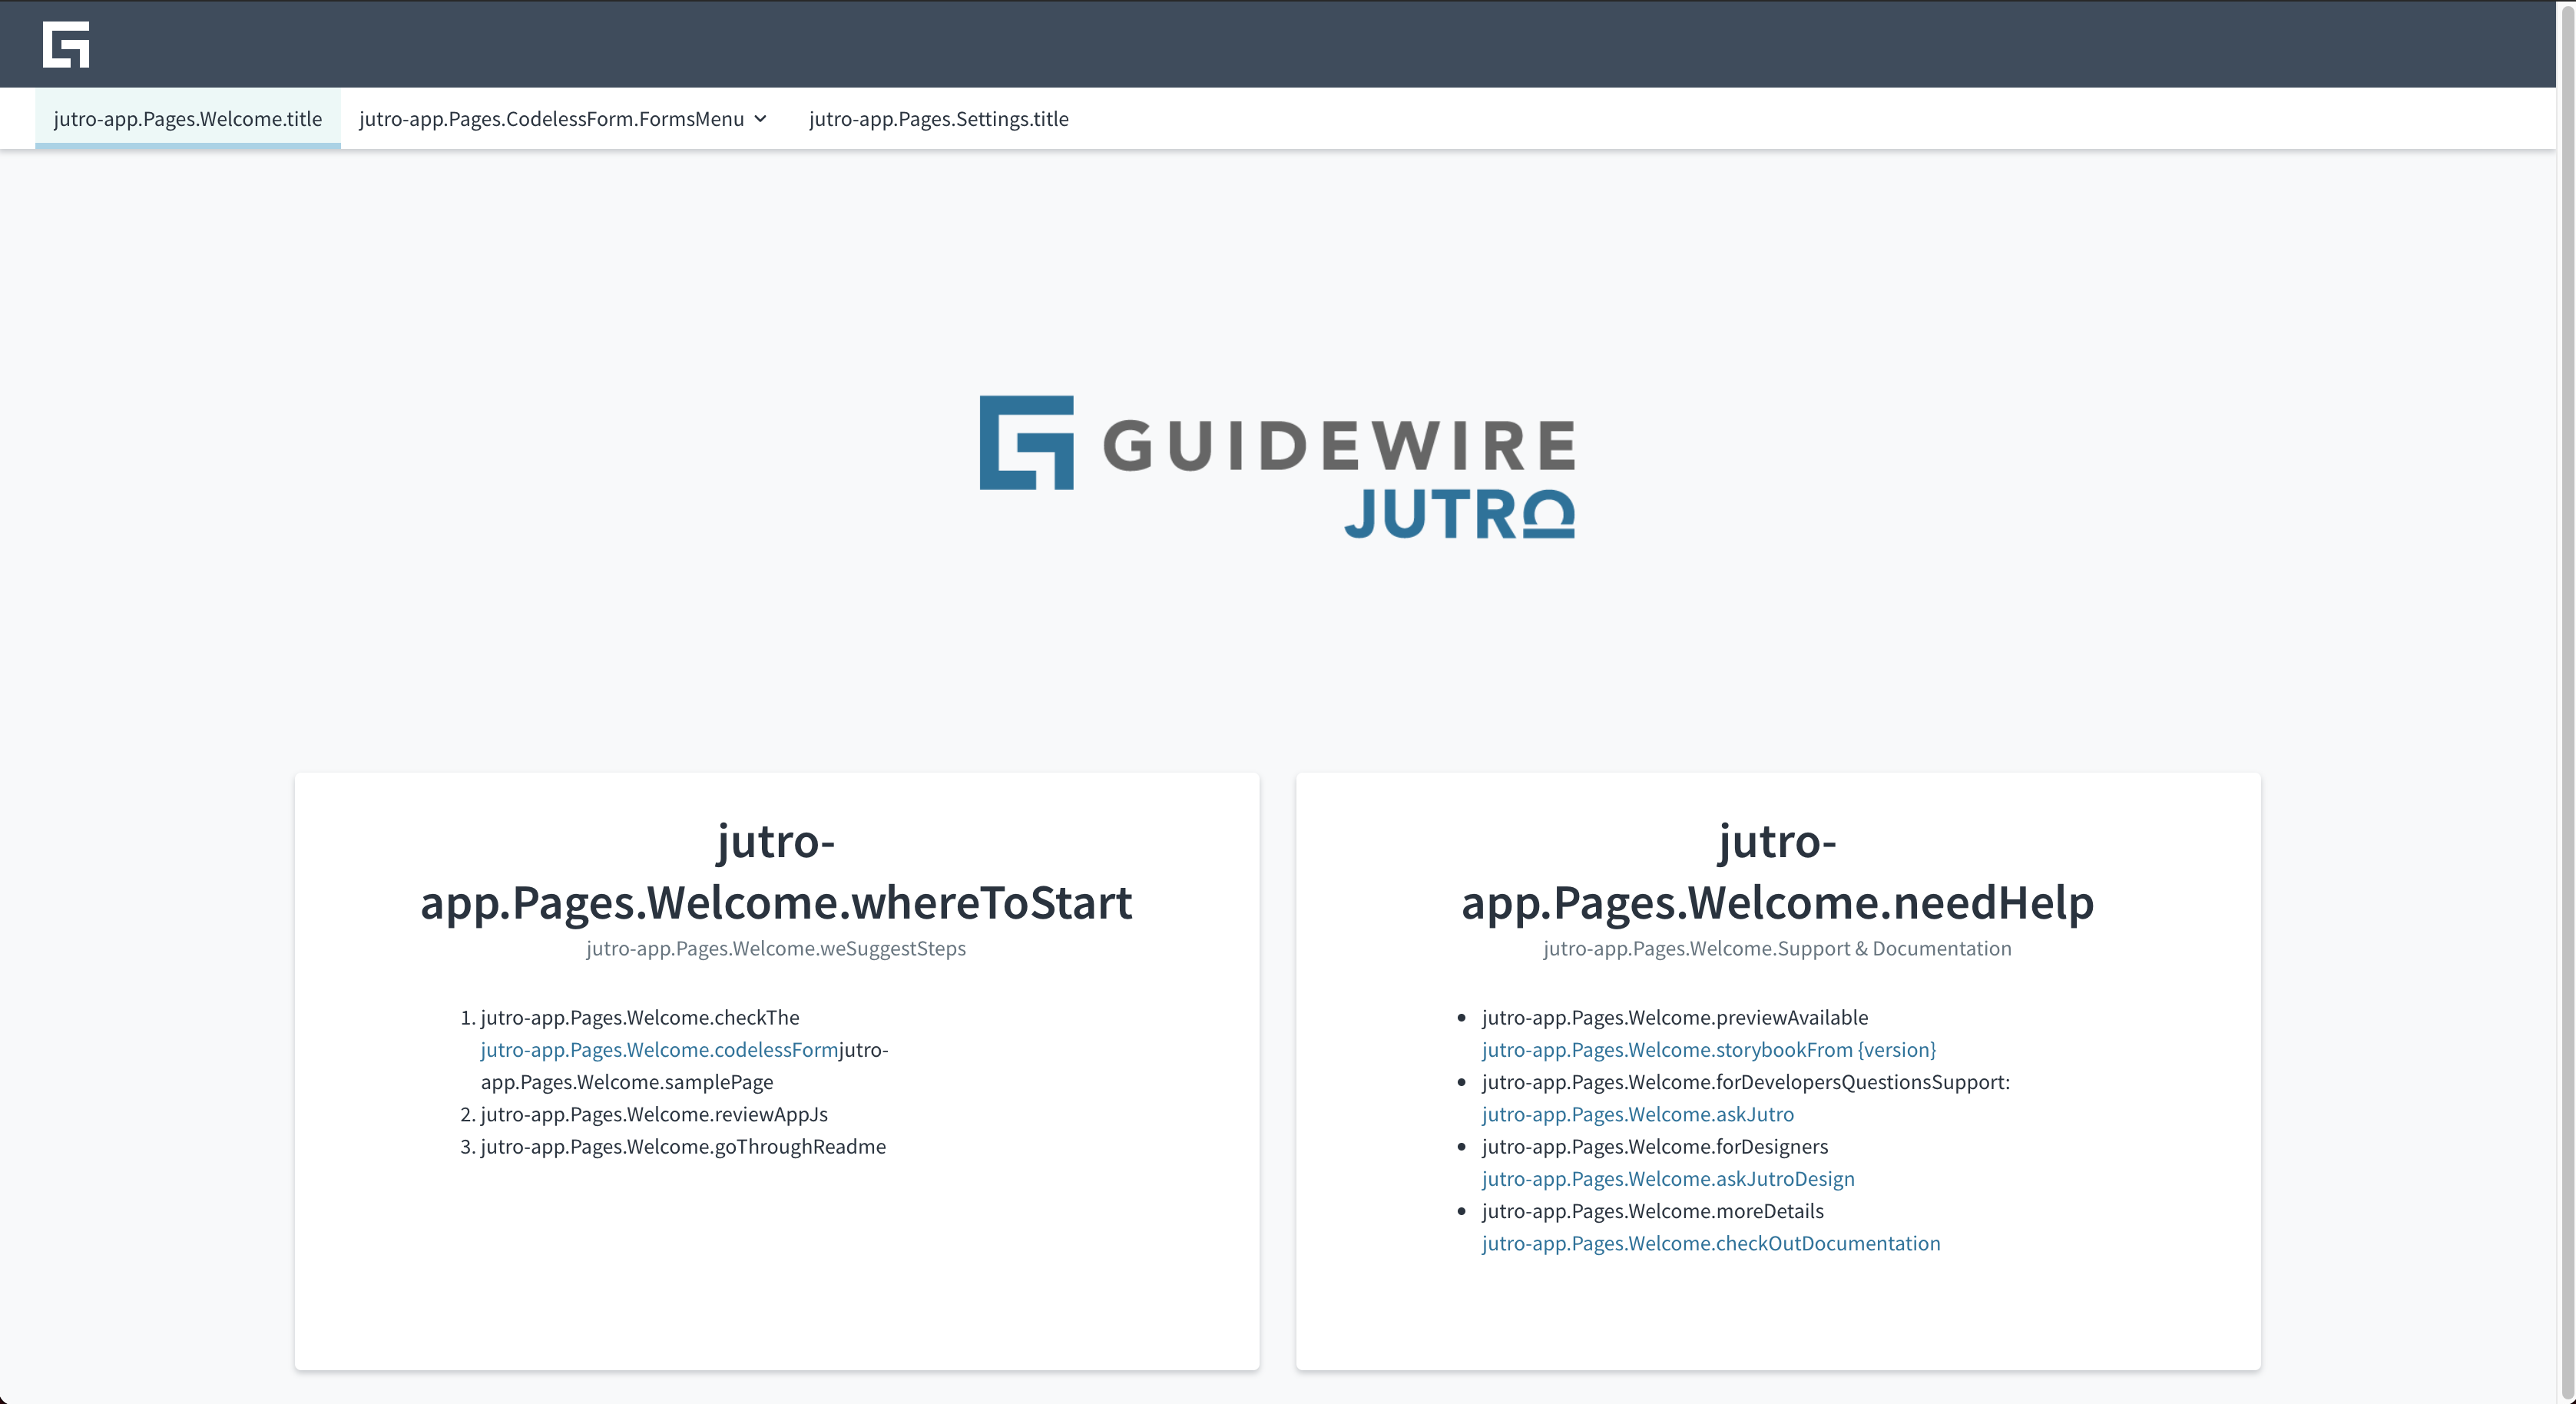
Finding the string ID of a translation
It may be difficult to figure out the string ID of a message displayed in the application. To simplify translation-independent testing, there are 2 options to display string IDs instead of actual translations:
- query parameter
displayStringId - environment variable
DEV_DISPLAY_STRING_ID=true(requires application restart)