Floorplans for data visualization
Overview
The goal of this section is to provide best practice guidelines for incorporating data visualization patterns into Guidewire analytics floorplans. These patterns, which include charts, graphs, and tables, facilitate deeper understanding of data storytelling and enhance decision support for their intended use cases.
Floorplans are page layout blueprints that contain specific combinations of UI elements to support specific use cases, such as case management and application performance monitoring. Two of the most common floorplans in the Guidewire product ecosystem are dashboards and embedded analytics.
Dashboards
An analytics dashboard is a floor plan that displays configurable KPIs and metrics in an interactive format. Dashboards help users quickly understand data through visualizations, spot trends in data, and track changes to data over time.
The core building blocks used to create a dashboard floor plan are cards, which contain the data summaries and performance KPIs that are relevant to the use case. The way cards are organized can impact how data is consumed by the end user. As a rule of thumb, the most important pieces of information are located in the top-left corner of the dashboard.
When to use
Case management
Designers need to understand a user's needs, goals, and desired insights in order to prioritize and group data on a dashboard, which in turn increases how efficiently that data is consumed by the user. In the Guidewire product ecosystem, case management personas include claims adjusters, claims supervisors, underwriters, and commercial agents. These personas deal with high volumes of data on a daily basis, and their primary goal is task management efficiency and yearly target progress.
Empathy mapping and deep dive consultations with customers and subject matter experts can reveal the specific requirements that are unique to each persona and user. Some examples of desired content for the case management personas are shown below (based on workshop feedback).
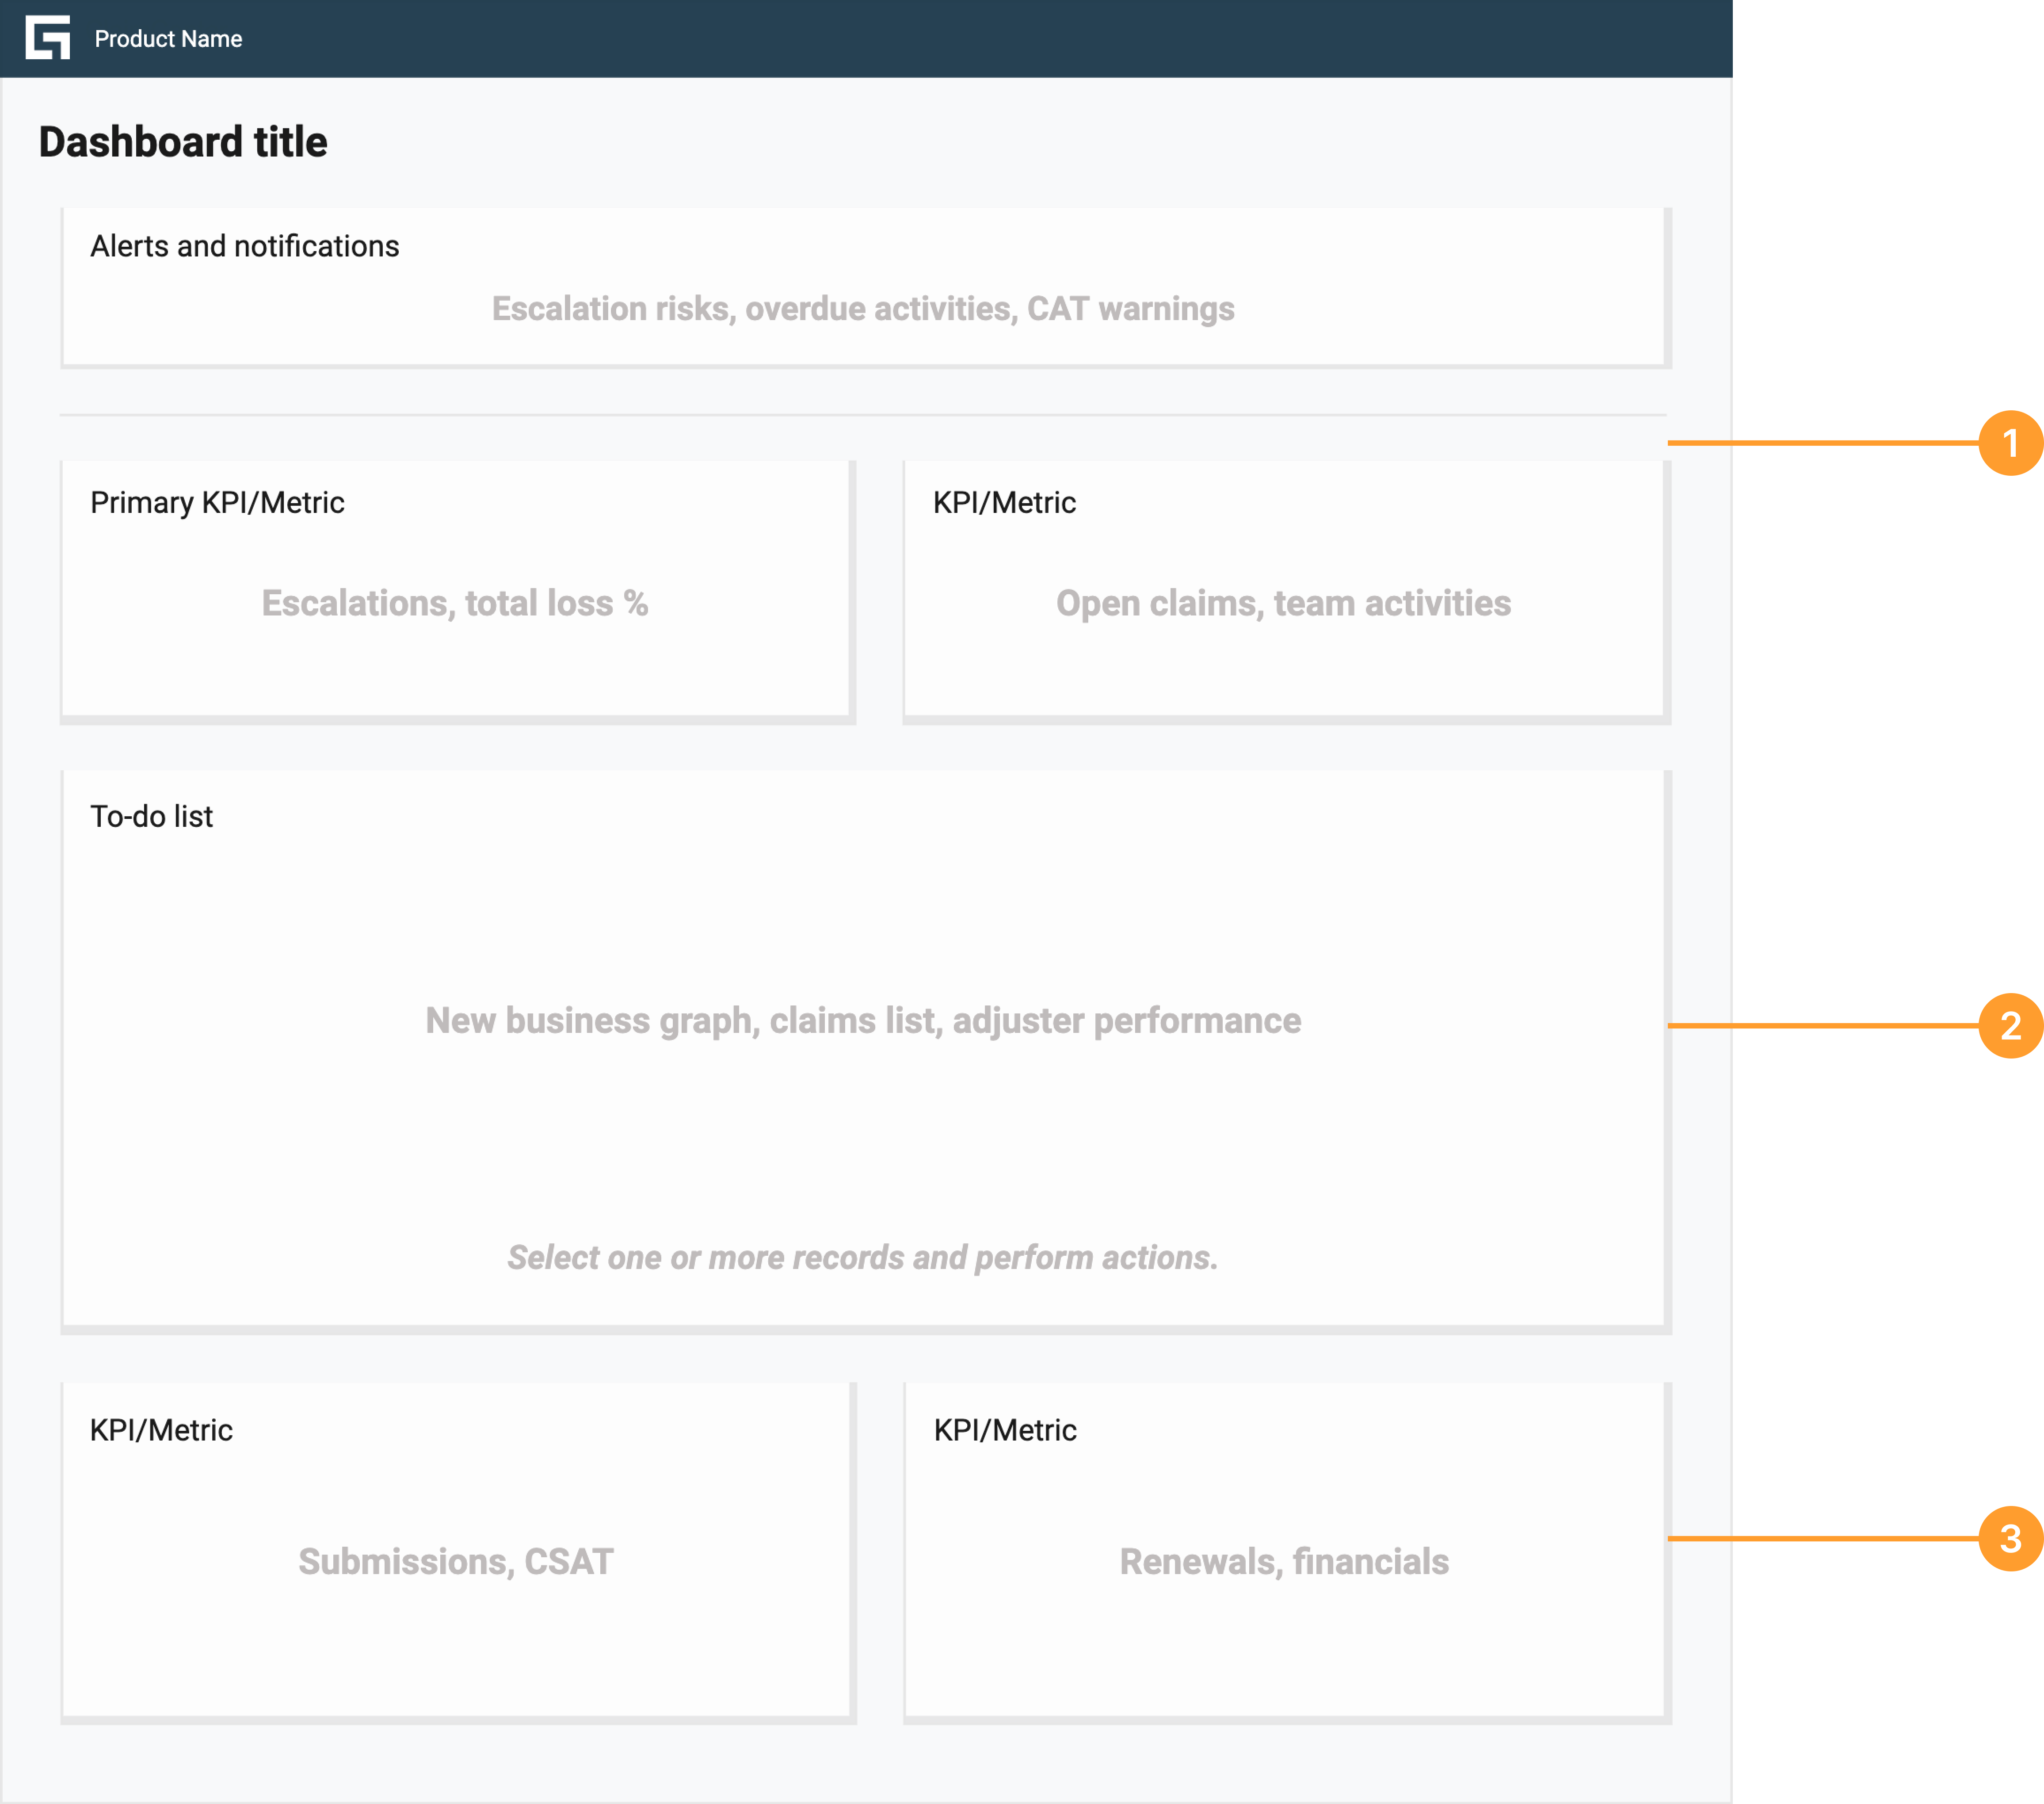
The dashboard pattern for case management consists of the following prioritized content:
- Primary importance: urgent tasks, important KPIs, alerts, escalations
- Secondary importance: lists or grids that summarize the user's book of business, or pod members
- Lowest importance: submission and renewal statuses, customer satisfaction metrics, activity assignments
Embedded amalytics
This section is currently under development. Embedded analytics patterns are being defined. Check back soon for updates.
Related components and patterns
Components
Patterns
Resources
For examples of data visualization floorplans, refer to the floor plan and pattern usage page in Figma.