Datadog event logging
Introduction
The Datadog browser log SDK can send logs JS clients. It can leverage the following features:
- Use the SDK as a logger. Everything is forwarded to Datadog as JSON documents.
- Add context and extra custom attributes to each log sent.
- Wrap and forward every frontend error automatically.
- Optimized network usage with automatic bulk posts.
Configuration
You can use the following parameters to configure Datadog:
clientToken(required): a Datadog client tokenserviceName: service name for the application (the default value is Jutro)env: the environment in which the application is running. For example:atmos-staging,atmos-dev
Which Atmos environment should I use?
You can find more information about environments here.
Where do I get the token?
You can find details about getting access to Datadog and a token here. You can get the token from here: https://app.datadoghq.com/organization-settings/client-tokens
Client Token can be obtained from AWS SSM in the Teamcity pipeline using the command:
aws ssm get-parameter --with-decryption --output text --query Parameter.Value --name "tenant-jutro-datadog-client-token"
Using Datadog in a new app
You will see several questions regarding Datadog during the process of creating a Jutro app.
-
Enable Datadog? - enter
yes -
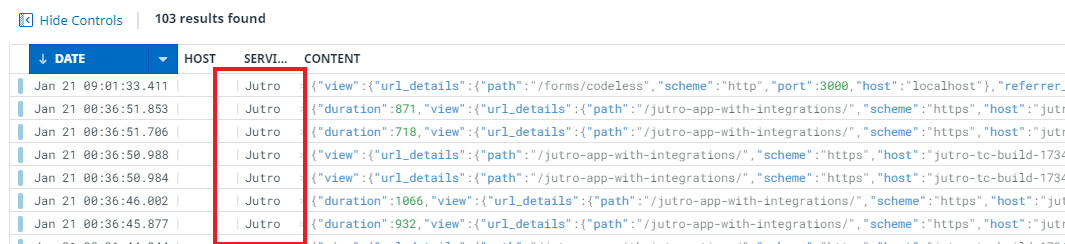
Service name to be used for Datadog log - provide the service name you want to see in logs. It is "Jutro" by default.
-
Datadog client token - provide the client token (there are instructions for getting the token above).
-
Datadog environment (dev | prod ) - choose the environment. It is "dev" by default.
The following is a list of aliases for some of the most commonly used Datadog environments:
- atmos-dev:
dev - atmos-int:
int - atmos-staging:
staging - omega2-circinus:
circinus-omega2 - omega4-sunflower:
prod-us-east-2 - omega2-cartwheel:
cartwheel-omega2
When choosing the environment, always use the alias if it is one of the environments listed above.
Adding Datadog to an existing app
To use Datadog in your application, add the following variables to your .env file:
REACT_APP_JUTRO_DATA_DOG_CLIENT_TOKEN
REACT_APP_JUTRO_DATA_DOG_SERVICE_NAME
REACT_APP_JUTRO_DATA_DOG_ENV
Optionally, you can also set:
REACT_APP_JUTRO_DATA_DOG_SITE # allowed values are 'EU' or 'US'
REACT_APP_JUTRO_DATA_DOG_SITE=EUsets your Datadog site todatadoghq.eu.REACT_APP_JUTRO_DATA_DOG_SITE=USsets your Datadog site todatadoghq.com.- Default is
datadoghq.com.
Standardmäßig verarbeitete Ereignisse
Standardmäßig wird für die hier beschriebenen Jutro-Ereignisse die DataDog-Integration zu den folgenden Gruppen hinzugefügt. Wenn Ihre App also abonniert ist, werden Ereignisdaten standardmäßig an DataDog gesendet.
- UNKNOWN_ERROR,
- FETCH_ERROR,
- FETCH_REQUEST,
- FETCH_RESPONSE
Bei Jutro-Ereignisse können Sie verschiedene Ereignisthemen abonnieren. Weitere Einzelheiten dazu finden Sie hier.
JUTRO_DISABLE_AUTO_EVENTS_PUBLISHING=true in Ihrer .env-Datei haben, müssen Sie zuerst ein Ereignis veröffentlichen und abonnieren. Weitere Informationen finden Sie in der Dokumentation zur Ereignis-API.Zum Beispiel, um UNKNOWN_ERROR zu abonnieren:
import { publish, subscribe, JUTRO_TOPICS } from '@jutro/events';

publish(JUTRO_TOPICS.UNKNOWN_ERROR, val: 'unknown error');

subscribe(JUTRO_TOPICS.UNKNOWN_ERROR, (error) => {
  //... your analytics code
});
Um das vollständige Ereignis-Abonnement zu aktivieren, legen Sie REACT_APP_JUTRO_DATA_DOG_FULL_LOG=true in der .env-Datei fest.
REACT_APP_JUTRO_DATA_DOG_FULL_LOG=true
Dadurch werden die folgenden Ereignisse aktiviert:
VALUE_CHANGEDFIELD_BLURBUTTON_CLICKEDLINK_CLICKED
Jutro bietet Standard-Ereignistypen für seine Komponenten. Sie sind in einem Objekt namens JUTRO_TOPICS definiert, das wie folgt aussieht:
const JUTRO_TOPICS = {
    COMPONENT_LOADED: 'JUTRO_TOPICS.COMPONENT_LOADED',
    VALUE_CHANGED: 'JUTRO_TOPICS.VALUE_CHANGED',
    FIELD_BLUR: 'JUTRO_TOPICS.FIELD_BLUR',
    ROUTE_CHANGED: 'JUTRO_TOPICS.ROUTE_CHANGED',
    ...
};
Sie können JUTRO_TOPICS finden, etwa dieses: import { JUTRO_TOPICS } from '@jutro/events';
Benutzerdefinierte Nachrichten senden
Sie können benutzerdefinierte Nachrichten und Fehler mit bestehenden Jutro-Themen senden:
import { publish, subscribe, JUTRO_TOPICS } from '@jutro/events';

publish(JUTRO_TOPICS.UNKNOWN_ERROR, { val: 'map clicked' });
subscribe(JUTRO_TOPICS.UNKNOWN_ERROR, (event) => console.log(event));
Benutzerdefinierte Ereignisse
-
Importieren Sie Folgendes:
import { subscribe, publish, JUTRO_TOPICS } from '@jutro/events';
import { datadogLogs } from '@datadog/browser-logs'; -
Veröffentlichen Sie das gewünschte Thema:
publish('PRODUCT_VIEW', { test: 'jutro-custom' }); -
Abonnieren und verwenden Sie den Datadog-Logger mit der gewünschten Protokollstufe:
subscribe('PRODUCT_VIEW', () => {
  datadogLogs.logger.error(JSON.stringify('custom-error'), {
    sourceCategory: 'PRODUCT_VIEW',
  });
});
Datadog Real User Monitoring
Real User Monitoring (RUM) gives you an insight into the real time activity and experience of individual users. It addresses the following four aspects of monitoring web and mobile applications:
- Performance: Track the performance of web pages, mobile application screens, user actions, network requests, and your front-end code.
- Error Management: Monitor ongoing bugs and issues, track them over time and across versions.
- Analytics / Usage: Understand who is using your application (the user's country, device, or operating system), monitor individual user journeys, and analyze how users interact with your application (most common pages visited, clicks, interactions, and feature usage).
- Support: Retrieve all of the information related to a user session to troubleshoot issues (session duration, pages visited, interactions, resources loaded, and errors).
Setting up RUM
The current implementation of Datadog integration with Jutro is completely separate from Datadog RUM. The current implementation is based on the JUTRO_TOPICS event being emitted and sent as logs to the Datadog server. RUM is a different solution that is independent from this event emission, and requires its own setup.
RUM applications must be created using the 'New Application' button on the RUM Applications page. You must give the application a name and a type, for Jutro apps the type is 'JS'. After doing this, an applicationId and clientToken are generated.
When prompted to choose the installation type for the RUM Browser SDK, choose npm. Integration code will then be generated automatically, and will look similar to the following:
import { datadogRum } from '@datadog/browser-rum';

datadogRum.init({
  applicationId: 'generated-application-id',
  clientToken: 'generated-client-token',
  site: 'datadoghq.com',
  service: 'jutro-rum-test',

  // Specify a version number to identify the deployed version of your application in Datadog
  // version: '1.0.0',
  sampleRate: 100,
  sessionReplaySampleRate: 0,
  trackInteractions: true,
  trackResources: true,
  trackLongTasks: true,
  defaultPrivacyLevel: 'mask-user-input',
});
To ensure that tracking is working properly after applying the config you can test it by opening a tracked app in your browser and generating some traffic. Verify that data is being reported successfully by checking the 'Verify your installation' section after doing this.