Geo map
Introduction
A geospatial chart focuses on the relationship between data and its physical location to create insight. Maps are the primary focus of geospatial visualizations, and any positional data works for spatial analysis.
When to use
Insurance
Insurance providers can use geospatial data to track customers and offer support to policyholders who are adversely impacted by weather events.
Logistics optimization
Geospatial data can be used for logistic and route optimization. Leveraging location-based information enables data-driven decisions for optimizing operations, delivery schedules, and inventory management.
Fraud prevention
Geospatial data visualization can help companies detect and prevent fraudulent activity from their employees and/or customers. This is done by monitoring activities and comparing them with historical data.
Resource management
Detailed geospatial maps coupled with real-time tracking improves organizational efficiency by clearly indicating asset locations for route and delivery optimization.
When not to use
Don't use geo maps if the story you're trying to tell is about data comparison or composition, rather than the distribution of points. Also, if your data is purely numerical or categorical, or doesn't have any spatial patterns, a geo map might not be the best choice.
Geo map examples
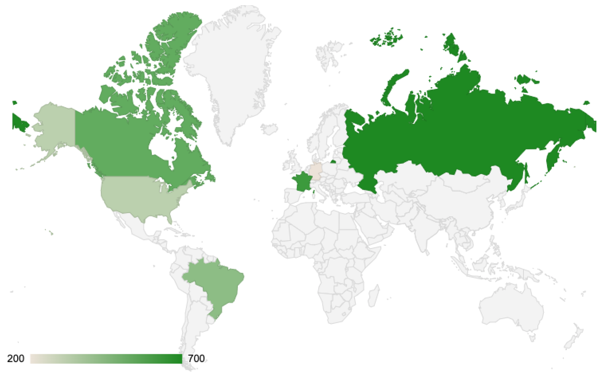
Geospatial map for visualizing a quantitative scale across continents
Recharts code
To explore how to create geo maps using Recharts, see the following:
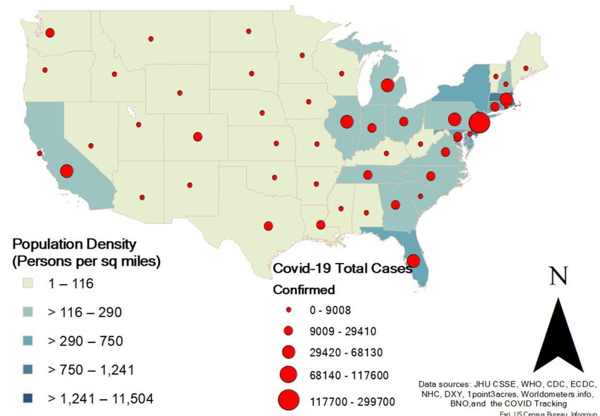
Geospatial chart for tracking Covid-19 cases across various population densities
Charts.js code
To explore how to create geo maps using Chart.js, see the following:
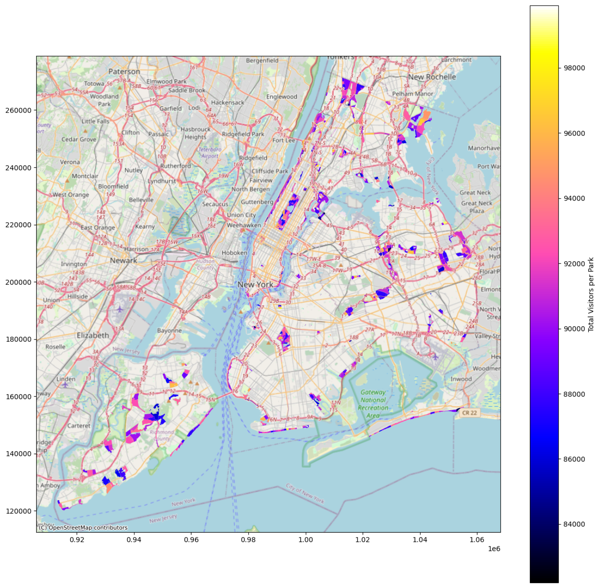
Geospatial map for visualizing public park traffic in New York City
Resources
Informationen zum Zugriff auf Datenvisualisierungskomponenten für Wireframing und Storyboarding finden Sie in den Datenvisualisierungsmustern auf Figma.